02
Jun 10

It’s your move

I’m thinking of two numbers between 0 and 1. Your goal is to guess a number which falls in between my two numbers. Each guess costs you $1, and if you guess correctly you win the reciprocal of the length of my range (ie if I am thinking of 0.2 and 0.4, a correct guess wins you $5). At any time you may request that I choose of a new pair of numbers, and of course I will pick a new pair of numbers whenever you win.

What’s your strategy? Under certain conditions, this game is fair. How might you be able to have a positive expectation?


31
May 10

Betting on Pi

I was reading over at math-blog.com about a concept called numeri ritardatari. This sounds a lot like “retarded numbers” in Italian, but apparently “retarded” here is used in the sense of “late” or “behind” and not in the short bus sense. I barely scanned the page, but I think I got the gist of it: You can make money by betting on numbers which are late, ie numbers that haven’t shown up in a while. After all, if the numbers in a lottery or casino are really random, that means it’s highly unlikely that any one number would go a long time without appearing. The “later” the number, the more likely it is to appear. Makes sense, right?

Before plunking down my hard(ly) earned cash at a casino, I decided to test out the theory first with the prototypical random number: Pi. Legend has it that casinos once used digits from Pi to generate their winning numbers. Legend also has it that the digits of Pi are so random that they each appear with almost exactly 1 in 10 frequency. So, given this prior knowledge that people believe Pi to be random, with uniform distribution of digits and no discernible pattern, I can conclude that no one digit should go too long without appearing.

I pulled down the first 10 million digits from here (warning, if you really want this data, right click the link and “save as”). Then I coded up a program in the computer language R to scan through the digits of Pi, one by one, making a series of “fair” bets (1:9 odds) that the next number to appear in the sequence would be the one that had gone longest without appearing. My code is shown below. I had to truncate the data to 1 million digits, and even then this code will take your Cray a good while to process, most likely because I have yet to master the use of R’s faster “apply” functions with complicated loops.

myPi = readLines("pi-10million.txt")[1]

# I think this is how I managed to get Pi into a vector, it wasn't easy.
piVector = unlist(strsplit(myPi,""))
piVector = unlist(lapply(piVector,as.numeric))

# In honor of Goofy Programming Day, I will
# track how long since the last time each digit appeared
# by how many repetitions of that digit are in a vector
ages = c()

# Start us off with nothing in the bank
potHistory = c()

# R just loves long loops like this. Hope you have a fast computer
for(i in 1:1000000) {
	# How did our bet do last round?
	# Skip the first 100 just to build up some data
	if(i > 100) {
		if(betOn == piVector[i]) {
			potHistory = c(potHistory, 9)
		} else {
			potHistory = c(potHistory, -1)
		}
	}

	# Increase all ages by 1 by adding to vector, then set the one we found to 0
	ages = c(ages, 0:9)
	ages = ages[!ages == piVector[i]]

	# Count occurences of each digit, find the top digits by occurence to bet on
	# And you thought Perl was beautiful?
	betOn = as.numeric(names(sort(-table(ages)))[1])
}

# Plot the cumulative sum at 1000 point intervals.
plot.ts(cumsum(potHistory)[seq(0,1000000,500)],pch=20,col="blue",xlab="step/500",ylab="cumulative earnings")

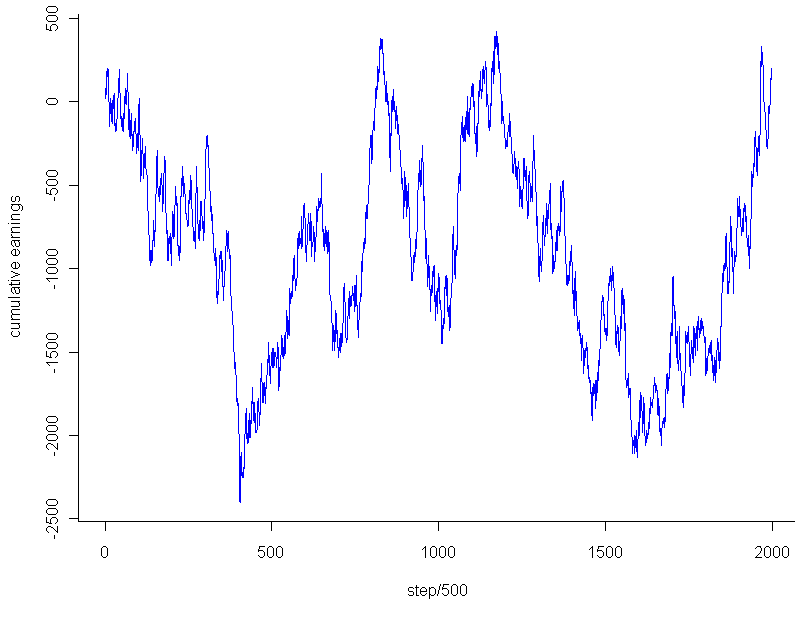
So what was the result? How good was my strategy? After an initial 100 digits to build up data about which digits were latest, I placed a total of 999,900 bets at $1 each. Final earnings: $180. That’s so close to breaking even that it’s almost inconceivable. I had 100,008 wins and 899,892 losses. My winning percentage was 10.0018% percent.

On the face of it, this result seemed almost a little too good, dare I say even suspiciously good, if you know what I mean. How rare is it to get this close (or closer) to the exact perfect proportions after so many trials? Assuming that the number of wins followed a binomial distribution with [latex]p=0.1[/latex], my total wins should follow a Normal distribution with mean 99,990 and variance [latex]n*p*(1-p) = 89,991[/latex] (for an “n” of almost a million and non-minuscule “p”, the Normal approximation to the Binomial should be essentially perfect). Taking the square root of the result, and we get almost exactly 300 as our standard deviation. That’s much larger than the 18 extra wins I had. In fact, the chances that you will land within [latex]18/300 = 0.06[/latex] standard deviations on either side of the Normal’s mean are less than 5%. Before getting too worked up over this result, I decided to take a look at the graph. Using the code:

plot.ts(cumsum(potHistory)[seq(0,1000000,500)],pch=20,col="blue",xlab="step/500",ylab="cumulative earnings")

I got this:

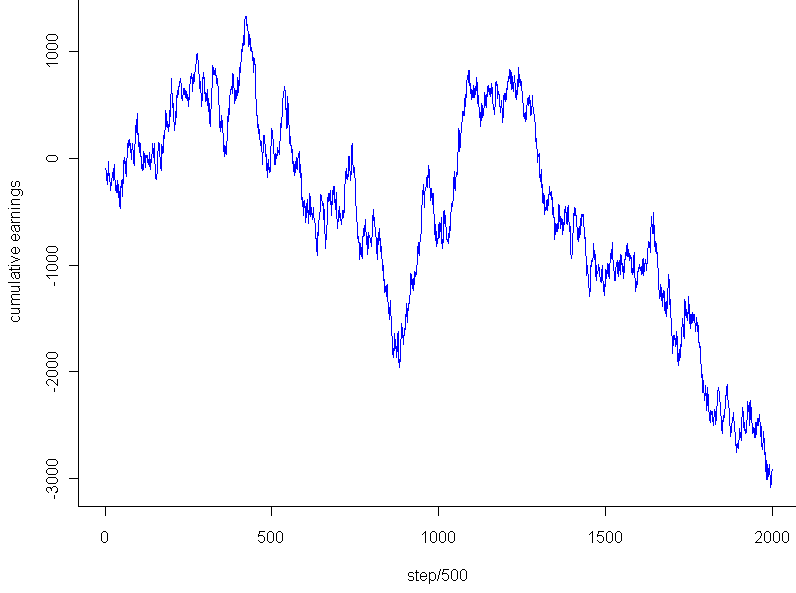
The graph looks pretty much like any random walk, doesn’t it? So the fact that I ended up breaking almost exactly even had to do with the stopping point, not any “unusual” regularity. Just to see if I might salvage any mystery, I tested the very lowest point, -$2,453, which occurred after 202,133 trails. Even that falls within 2 standard deviations of the expected mean for that number of trials, and of course cherry picking the most extreme point to stop at isn’t a fair way to go about this. Any last hope that the graph might be unusual? I plotted a couple random walks using numbers generated in R. Most of them looked like this:

This looks to have the same level of “jaggedness” as  the results of my bet on Pi. Unfortunately, I am forced to conclude that the promising strategy of “late number” gambling turned out to be fairly retarded after all, at least so far as it applies to the digits of Pi.


29
May 10

Weekend art in R (part 1?)


As usual click on the image for a full-size version. Code:

par(bg="black")
par(mar=c(0,0,0,0))
plot(c(0,1),c(0,1),col="white",pch=".",xlim=c(0,1),ylim=c(0,1))
iters = 500
for(i in 1:iters) {
	center = runif(2)
	size = rbeta(2,1,50)

	# Let's create random HTML-style colors
	color = sample(c(0:9,"A","B","C","D","E","F"),12,replace=T)
	fill = paste("#", paste(color[1:6],collapse=""),sep="")
	brdr = paste("#", paste(color[7:12],collapse=""),sep="")

	rect(center[1]-size[1], center[2]-size[2], center[1]+size[1], center[2]+size[2], col=fill, border=brdr, density=NA, lwd=1.5)
}

28
May 10

R: More plotting fun with Poission

Coded as follows:

x = seq(.001,50,.001)
par(bg="black")
par(mar=c(0,0,0,0)) 
plot(x,sin(1/x)*rpois(length(x),x),pch=20,col="blue")

28
May 10

The guessing game in R (with a twist, of course)

Maybe you remember playing this one as a kid. If you are about my age, you may have even created a version of this game as one of your first computer programs. You guess a number, the computer tells you if you if you are too low or high. I’ve limited the number of maximum guesses, and randomized the computer’s choice based on the Poisson distribution (more on that later).

Here’s the code. This was part of my attempt to understand how R reads input from the command line. One of the things I learned: you may need to save this to a file and run it with “source()”, instead of running it directly from the console, line by line.

# Classic guessing game with twist
x = 0
gotRight = 0
failed = 0

# Initial lambda for our random var
correct = 2000
initial = correct

# How many guesses should we allow per number
maxGuesses = 7
	
while(x != Inf) {
	# The +1 part makes sure we never get zero, which would trigger 0's forever
	correct = rpois(1,correct) + 1
	
	# The advantage of using "cat" instead of "print" is that you remove those pesky quotation marks
	cat("I am thinking of a number between 1 and infinity. What is it? (Type Inf to quit)\n")
	
	# Solicit input from the user
	x = scan(n=1) # Just one item in this vector
	
	# Be nice and let the user quit. 
	if(x == Inf) {
		cat("The correct answer was", correct, "\n")
		cat("You got", gotRight, "right and failed", failed, "times. Maximum allowed guesses was", maxGuesses, "and initial lambda was", initial, ". Goodbye.\n")
		cat("Post your score to http://www.statisticsblog.com/2010/05/the-guessing-game-in-r-with-a-twist-of-course/#comments \n")
		break
	}
	
	for(i in 1:maxGuesses) {
		if(x == correct) {
			print("You rock!")
			gotRight = gotRight + 1
			break
		} else {		
			if(i == maxGuesses) {
				cat("You ran out of guesses. I will pick a new random number based on the last one.\n")
				failed = failed + 1
			} else {
				if(x < correct) {
					cat("You are too low. Guess again.\n")
				} else {
					cat("You are too high. Guess again.\n")
				}
				
				x = scan(n=1)
			}			
		}
	}
}

Note 1: My code makes a couple uses of the aparently controversial "break" function. I can still recall a heated debate I had with a CS professor who believed that calling "break" (in Python) was as bad as crossing the streams of your Proton Pack. That said, I have sucessfully used it on several occasions now without any appearance by Stay Puft Marshmallow Man or changing the natural order between dogs and cats. In R, the biggest problem with using constructs like "break" and "while" is that, for reasons clear only to readers of this blog but not myself, if you ask R for help about either of these tokens using

?term

you get an sent an error or to purgatory, respectively.

Hint: Because the random guesses are Poisson based, using a "half the distance" strategy for guessing may not be the best way to go. The hardcore amongst yourselves might want to calculate the median of the expected value conditional on having guessed too low or high.

Note 2: The Poisson isn't a very good distribution for for this. Maybe you can find a better one, or at least jack up the dispersion like an overzealous offroader tweaking the suspension of his 4Runner.


26
May 10

Zone of instability

I woke up from my afternoon nap feeling a bit off-kilter, so I decided to go for another random walk. In particular, I wanted a journey that avoided the center, but didn’t just run for an exit either. After playing around for a while I came up with this:

# Take a wacky walk, return the final "track" steps
wackyWalk <- function(iters, track=iters) {
	locations = c()
	mean2use = 0
	sd2use = 1

	for (i in 1:iters) {
		mean2use = rnorm(1,mean2use,sd2use) 

		# The farther from the center, the smaller the variance
		sd2use = abs(1/mean2use)
		if(track > (iters - i) ) {
	 		locations = c(locations, mean2use)
	 	}
	}
	return(locations)
}

# How many steps to take
iters = 300
track = 300
locations = wackyWalk(iters,track)

# Start us off with a plot
plot(0,0,xlim=c(min(locations),max(locations)),ylim=c(0,iters),pch=20,col="white")

for (i in 1:track) {
	points(locations[i],i,pch=20,col="blue")

	# To create a pseudo animation, take a break between plotting points
	Sys.sleep(.10)
}

Basically, during each iteration the program samples from a normal distribution centered at the same location as the previous iteration, with standard deviation equal to the inverse of the previous location. So if the sequence is at 5, the next number will be sampled from the [latex]Normal(5, (\frac{1}5)^2)[/latex] distribution.

Run it a few times and you’ll see how the blue dot bounces around for a bit near 0, then shoots off to one side or the other, where it will most likely hang out for the rest of its life. There are a number of interesting questions about this sequence which, sadly, will remain unanswered. Among these are: For a given number of iterations, how many times is this sequence expected to cross zero? What is the maximum (or minimum) value the sequence is expected to obtain over a fixed number of iterations? Will the sequence ever diverge to some flavor of infinity?

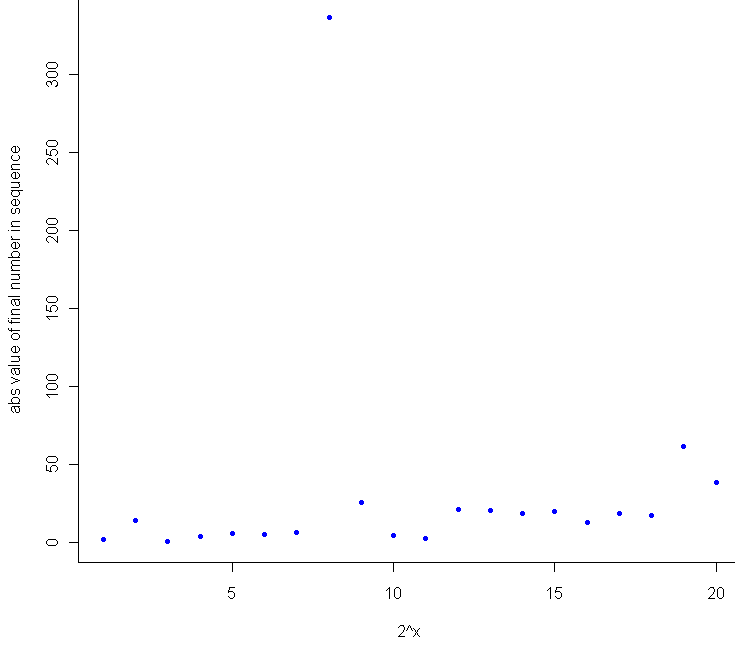
My hunch for this last question is to say no, since the normal distribution is thin-tailed, and the standard deviation is set to converge to 0 (slowly) as the value of the sequence gets larger and larger. At the same time, I suspect that the higher the number of iterations, the larger (in absolute terms) the final number in the sequence. This makes general sense, as the farther you get from 0, the harder it is to return to 0. During testing, I saw a lot of plots that wiggled back and forth, getting closer to the edges of the plot with each wiggle. Since I’m never content to just have a thought without actually testing it out, I plotted the final value in the sequence after [latex]2^x[/latex] iterations, where x went from 1 to 20. Here’s the result:

Sure enough, as a general trend, the more iterations you run, the farther you are from zero. It would have been interesting to see how the 8th trial ended up north of 300, but I only tracked the final result for these. I suspect that it made up most of the ground in a single leap while sampling from a Normal with extremely high variance (ie when the previous number was very close to 0).

Here’s the extra bit of code for comparing final location to number of iterations:

# How does the number of steps compare with distance from center
meta = c()
for (j in 1:20) {
	iters = 2^j
	track = 1
	meta = c(meta, wackyWalk(iters,track))
}

plot(1:20, abs(meta), pch=20, col="blue",xlab="2^x",ylab="abs value of final number in sequence")

These results, I should note, provide very little evidence that the sequence, if extended out to infinite length, will have to converge or diverge. Weird things happen when you start to consider random walks of infinite length, and the one sure limitation of Monte Carlo testing is that no matter how long let a computer simulation run, your PC will crash well before it performs an infinite number of calculations, and most likely before you finish your coffee.


25
May 10

How many tanks? MC testing the GTP

It’s 1943 and you work for the good guys. A handful of German tanks have been captured, and each one has a serial number. This is back when serial numbers were still presumed to come in serial, one right after the other. Given your collection of numbered tanks, and assuming that any existing tank was just as likely to be captured as any other, how many tanks would you guess that the Krauts have?

By luck, you have a time machine, so you jump forward in time, check out the Wikipedia entry, and copy down the formula [latex]\hat{N} = \frac{k+1}{k} m – 1 = m + \frac{m}{k} – 1[/latex], noting that [latex]m[/latex] should be replaced with the highest serial number encountered, while [latex]k[/latex] represents the number of tanks captured. Reading on, you see that Wikipedia has provided a rare nugget of actual understanding for a formula. This estimate represents “the sample maximum plus the average gap between observations in the sample”.

So you’re done, right? Just plug in to the formula, hand in your estimate to the commanding officer, go enjoy some R&R. Not so fast. Here at StatisticsBlog.com, nothing is believed to work until it passes the Monte Carlo test. To test out the formula I coded a simulation in R:

# Function to estimate maximum from sample "samp"
gTank <- function(samp) {
	 max(samp) + max(samp)/length(samp) - 1
}

# A blank log-log plot to get us started
plot(100,100, xlim=c(100,10^7), ylim=c(100,10^7), log="xy",pch=".",col="white",frame.plot=F,xlab="True value",ylab="Predicted")

# Let's track residuals
trueTops = c()
resids = c()
sampleTops = c()

x = runif(100,2,6)
for(i in x) {
	trueTop = 10^i
	for(j in 1:50) {
		observeds = sample(1:trueTop, 20) # No replacement here
		guess = gTank(observeds)

		# Plot the true value vs the predicted one
		points(trueTop,guess,pch=".",col="blue",cex=2) 

		trueTops = c(trueTops, trueTop)
		resids = c(resids, trueTop - guess)
		sampleTops = c(sampleTops, max(observeds))
	}
}

# Platonic line of perfectly placed predictions
lines(c(100,10^6),c(100,10^6),lty = "dashed",col="gray",lwd=1)

# Plot residuals too
windows()
plot(trueTops,log="x",resids,pch=20,col="blue",xlab="True value",ylab="Residual",main="Residuals plot")
abline(h=0)

mean(abs(resids))
mean(trueTops-sampleTops)

Which produces the following log-log plot:
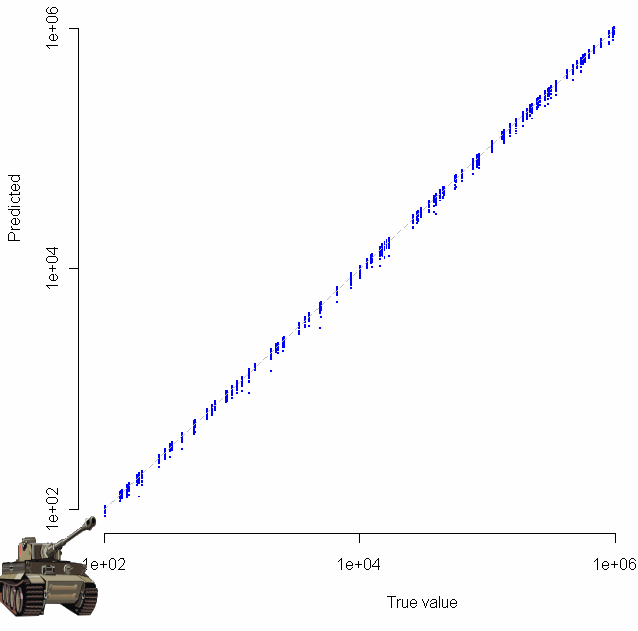
Gratuitous clip art was added with the “chartJunk()” function.

Looks pretty good, no? Especially given that the sample size for each of these tests was just 20. To make sure everything was OK, I plotted the residuals as well:
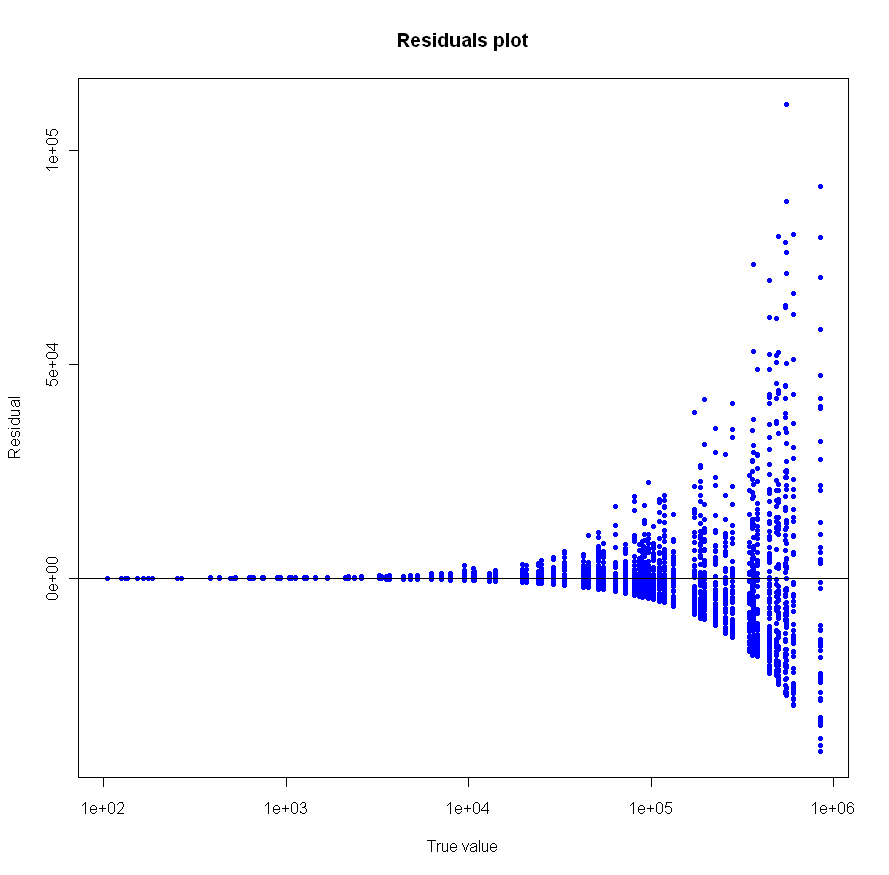
Make sure to click on the images above to see larger versions. Bigger really is better when it comes to viewing charts. Looks good too, no?

So, German tank problem estimate? Confirmed. Just don’t dig too deep into the assumption that all tanks had an equal chance of being captured; common sense goes against that one (ask yourself if there might be a relationship between length of time a tank is in the field of battle and the likelihood it will be captured).

Speaking of likelihood… this problem gives a nice example of how maximum likelihood estimation (MLE) can fail in spectacular form, like a bomb whose innards have been replaced by sawdust (alright, I promise, last military analogy). The MLE for the number of German tanks is the highest serial number observed. This is because MLE works backwards, finding the parameter which makes our observation most likely in terms of joint conditional probability. As a result, the MLE for this problem is not only biased (since it will always be less than or equal to the true number of tanks), but dumb as well. How likely is it (in the common sense usage of the term) that your captured tanks will include the highest-numbered one? If the distribution is truly uniform, the chance that you have to top one is [latex]\frac{k}N[/latex] where [latex]N[/latex] is the true, unknown number of tanks. You don’t know [latex]N[/latex], but you do know that it’s at least [latex]m[/latex] (the highest number observed). For small samples, where [latex]k << m[/latex], the probability that you have captured the very top-numbered tank is quite small indeed, no larger than [latex]\frac{k}m[/latex] at best.

Just how bad is the MLE? I compared the mean absolute residuals from the two different methods. Using the formula from at the beginning of this post gives 6,047. Using MLE, the average residual was 8,175, or 35% worse. Standard deviation for the MLE method is also higher, by about 27%. Back to boot camp for the MLE. (I know, I know, I promised).


20
May 10

R: A random walk though OOP land.

If you are used to object oriented programing in a different language, the way R does things can seem a little strange and backwards. “proto” to the rescue. With this library you can simulate “normal” OOP. I found the examples for proto not so helpful, so to figure out how the package works I sent one lonely red ant on a drunken walk. Here’s my code:

 
library("proto")

# Everybody likes ants
ant <- proto(
	# Default values for the class variables
	xPos = 0,            
	yPos = 0,
	name = character(),      
)

# What do ants do? They move
ant$move <-function(.,xDisp=0, yDisp=0) {
	.$xPos = .$xPos + xDisp
	.$yPos = .$yPos + yDisp
}

# See the little red ant move
ant$plot <- function(.) {
	points(.$xPos, .$yPos, pch=20, col="red")
}

# Instantiate the class. 
myAnt = ant
myAnt$name = "George"


plot(myAnt$xPos, myAnt$yPos, xlim=c(-10,10), ylim=c(-10,10), pch=20, col="red")
for(i in 1:40) {

	# The ant is drunk on Kool Aid
	myAnt$move(rnorm(1),rnorm(1))
	
	# The ant is lazy and will rest for a moment
	Sys.sleep(.5)
	
	# Plot the new location
	ant$plot()
	
}

cat("The ant named", myAnt$name, "is now located at (", myAnt$xPos, myAnt$yPos, ")\n")

18
May 10

R: Dueling normals

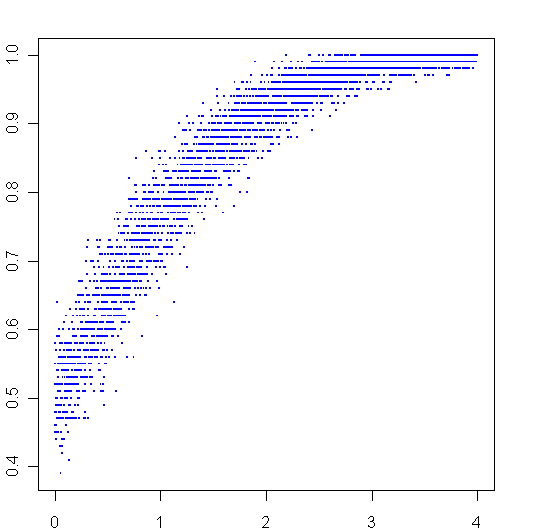
More playing around with R. To create the graph above, I sampled 100 times from two different normal distributions, then plotted the ratio of times that the first distribution beat the second one on the y-axis. The second distribution always had a mean of 0, the mean of first distribution went from 0 to 4, this is plotted on the x-axis.

Here is my code:

 
AbeatsB <- function(a,b) {
	sum(a>b)/length(a)
}

x = seq(0,4,.001)
y = c()
for (i in x) {
	y = c(y,AbeatsB(rnorm(100,i),rnorm(100,0)))
}

plot(x,y,pch=".",cex=2,col="blue")