Posts Tagged: art


4
Sep 10

Weekend art in R (Part 4)

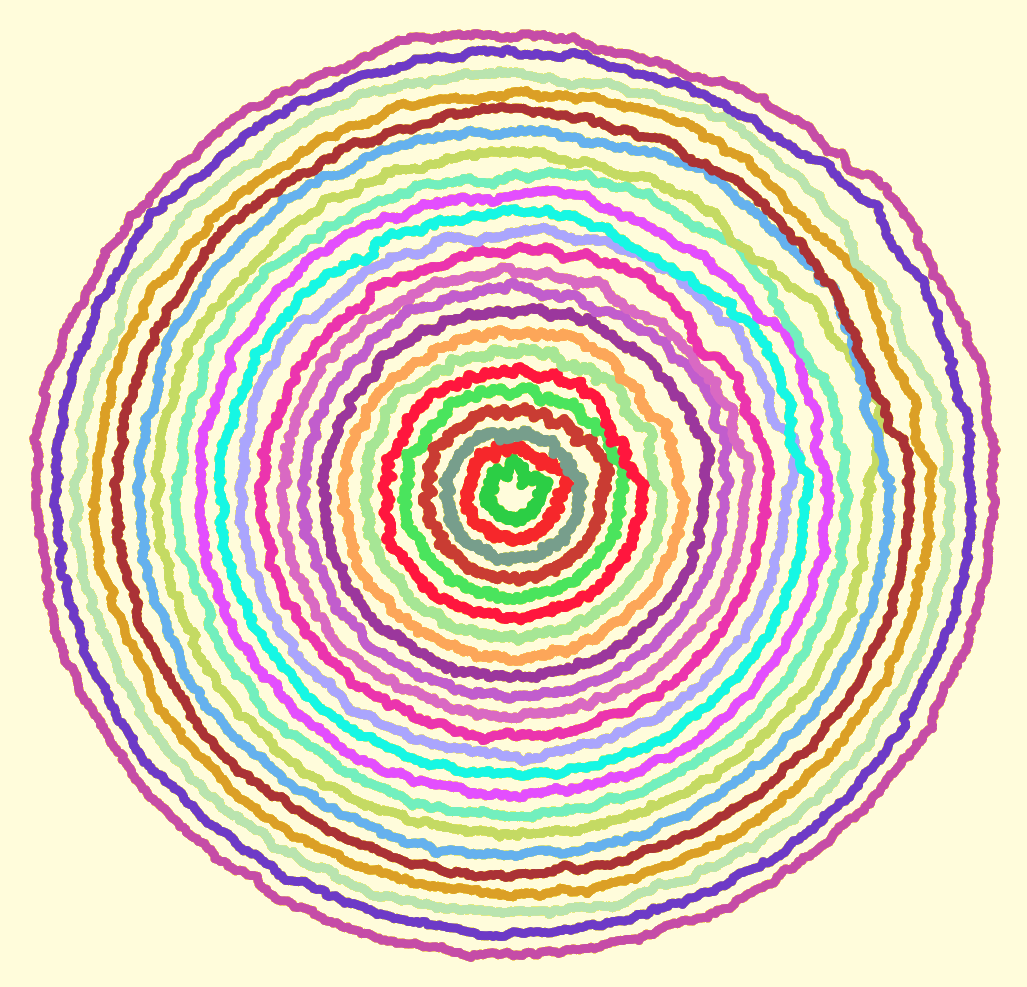
Computer creations are perfect by design. We put in numbers, and if all goes well we get out an exact result. If we want a line, we want it perfectly straight. If we want a circle, it should conform to the platonic ideal of a circle. From a mathematical standpoint, these perfect shapes and precisely computed numbers are ideal.

Someday, perhaps, we will have true fuzzy computation built right into our hardware. For now, it takes considerable effort to achieve just the right level of imperfection needed for simulating mistakes, or any organic processes.

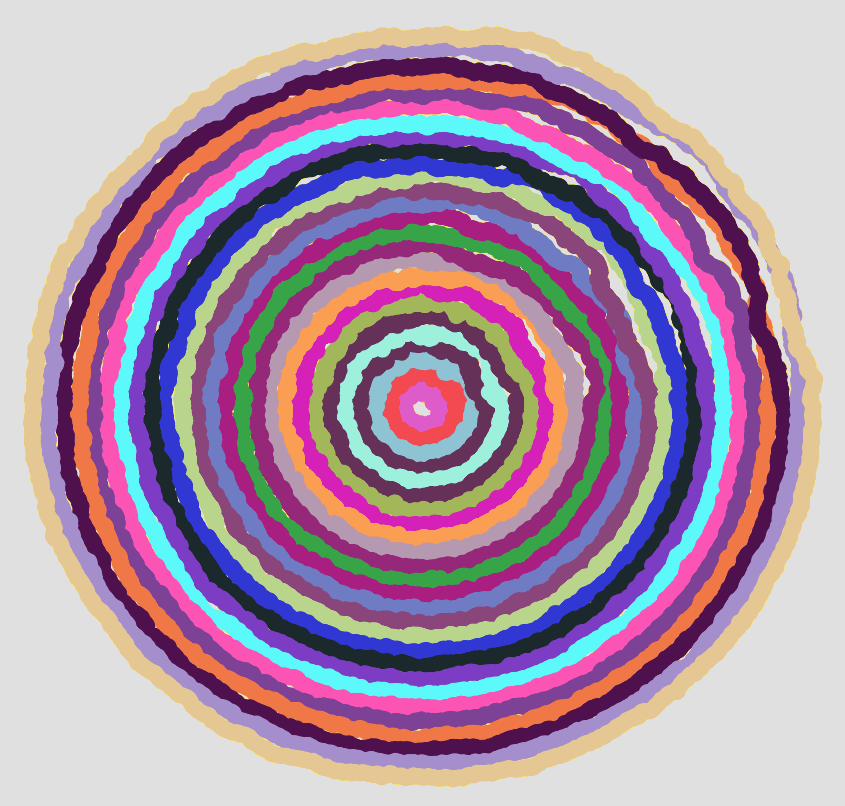
I sent each of the circles shown above on a random walk. That part was easy, getting each circle to end up where it started (and close the loop) took a bit more effort. To vary the “wigglyness” of the lines, adjust the “sd” parameter in “rnorm”. To change how quickly randomness tapers off, change the “4” in “i/4”. Here is my code:

# Circle lengths
j = seq(0.1,1.9,.08)

par(bg = "black")
plot(-2,-2,pch=".",xlim=c(-2,2),ylim=c(-2,2),col="white")

# How many dots around the circle?
dots = 1000

# Create an offkilter circle
rads = seq(0,2*pi,2*pi/dots)

for(aLength in j) {
	# Pick a random color
	myCol = paste("#",paste(sample(c(1:9,"A","B","C","D","E","F"),6,replace=T),collapse=""),collapse="",sep="")
	
	# Start at length = 1, then walk.
	myLength = rep(aLength,dots)
	
	for(i in 2:dots) {
		myLength[i] = myLength[(i-1)] + rnorm(1,0,sd=.005)
		
		# Closer we are to end, faster we return to where started so circle closes
		dist = aLength - myLength[i]
		myLength[i] = aLength - (dist*((dots-(i/4))/(dots)))
	}


	for(i in 1:dots) {
		cat(myLength[i]*cos(rads[i]),myLength[i]*sin(rads[i]),"\n")
		points(myLength[i]*cos(rads[i]),myLength[i]*sin(rads[i]),col=myCol,pch=20,cex=2)
	}
}

What do your circles look like?


21
Aug 10

Weekend art in R (Part 3)

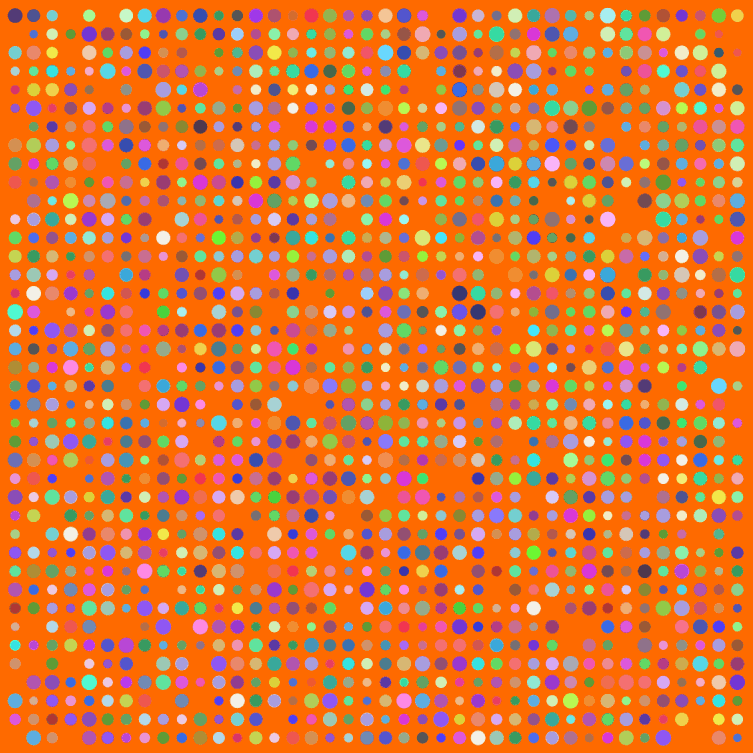
I have a few posts nearing completion, but meanwhile a weekend break for art. Big thanks to Simon Urbanek and Jeffrey Horner, creators of Cairo, a library for the programming language R. Have you noticed how R can’t anti-alias (fancy way for saying smooth out lines and curves when creating a bit-mapped image)? Cairo can.

Make sure to click the image above for the full version. Here’s my code:

# The Cairo library produces nice, smooth graphics
Cairo(1200, 1200, file="D:/Your/Path/Here/Dots.png", type="png", bg="#FF6A00")

# How big should the grid for placing dots be?
myWidth=40
myHeight=40

dotsPlaced = myWidth*myHeight

# Optional default colors and sizes for dots
myColors = rep(c("#0000F0","#00F000"),dotsPlaced)
myCex = rep(3.2,dotsPlaced)

for(i in 1:dotsPlaced) {
	# Change this to allow more of the default color dots to survive
	if(runif(1)<1) {
		myColors[i] = paste("#",paste(sample(c(3:9,"A","B","C","D","E","F"),6,replace=T),collapse=""),collapse="",sep="")
	}
	myCex[i] = runif(1,3,6)
}

# Keeping this is marginal
par(oma=c(0,0,0,0))
par(mar=c(0,0,0,0))

# Start off with a blank plot. The white dot helps with cropping later
plot(0,0,pch=".",xlim=c(0,40),ylim=c(0,40),col="white", xaxt = "n", yaxt = "n")

for(m in 1:myWidth) {
	for(n in 1:myHeight) {
		if(runif(1) < .93) {
			points(n,m,pch=20,col=myColors[((m*n)+n)],cex=myCex[((m*n)+n)])
		}
	}
}

dev.off() # Tell Cairo to burn the plot to disk

29
May 10

Weekend art in R (part 1?)


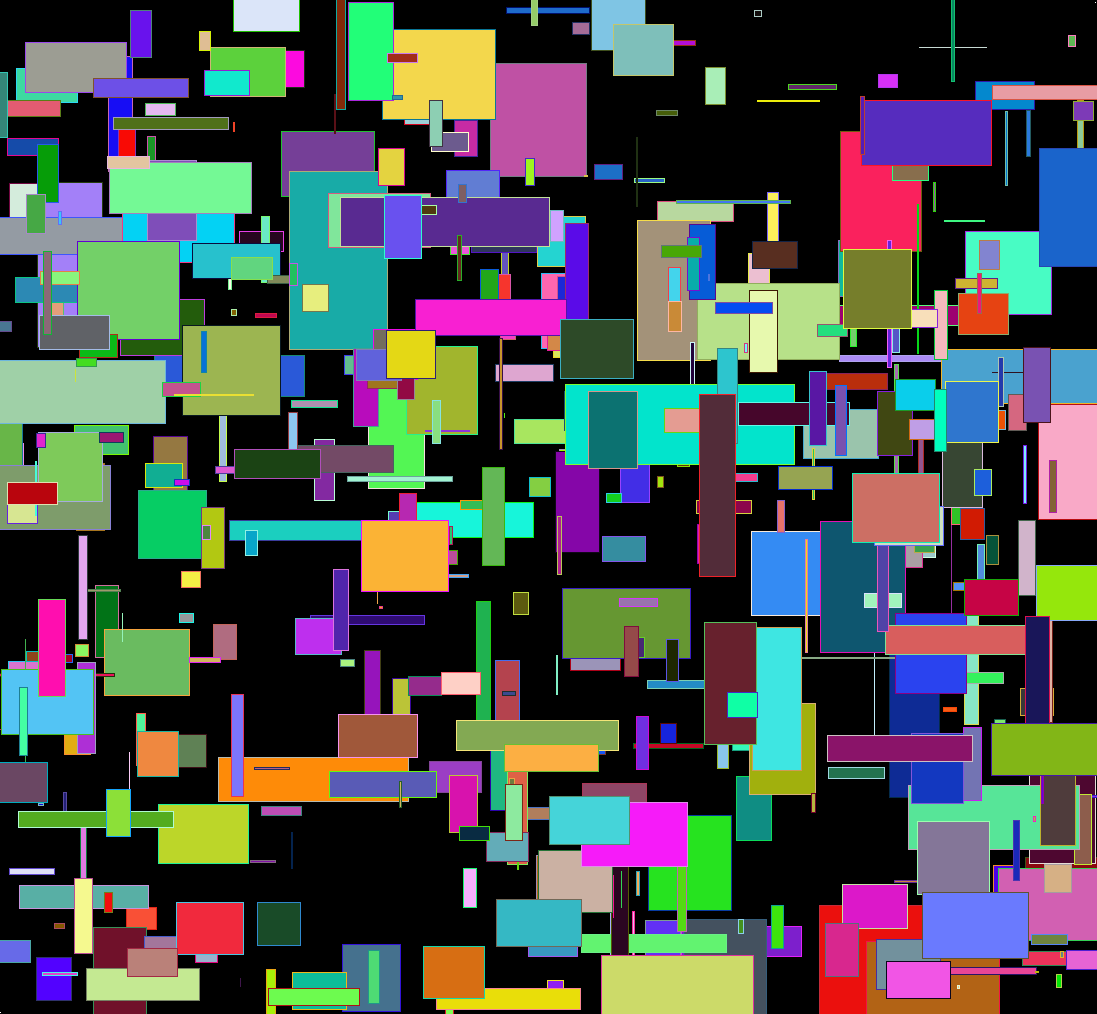
As usual click on the image for a full-size version. Code:

par(bg="black")
par(mar=c(0,0,0,0))
plot(c(0,1),c(0,1),col="white",pch=".",xlim=c(0,1),ylim=c(0,1))
iters = 500
for(i in 1:iters) {
	center = runif(2)
	size = rbeta(2,1,50)

	# Let's create random HTML-style colors
	color = sample(c(0:9,"A","B","C","D","E","F"),12,replace=T)
	fill = paste("#", paste(color[1:6],collapse=""),sep="")
	brdr = paste("#", paste(color[7:12],collapse=""),sep="")

	rect(center[1]-size[1], center[2]-size[2], center[1]+size[1], center[2]+size[2], col=fill, border=brdr, density=NA, lwd=1.5)
}