- Wiekvoet presents a simple R trick that allows you to plot y and log(y) in one figure – this is very useful for analyses where you need to compare growth rates of functions.
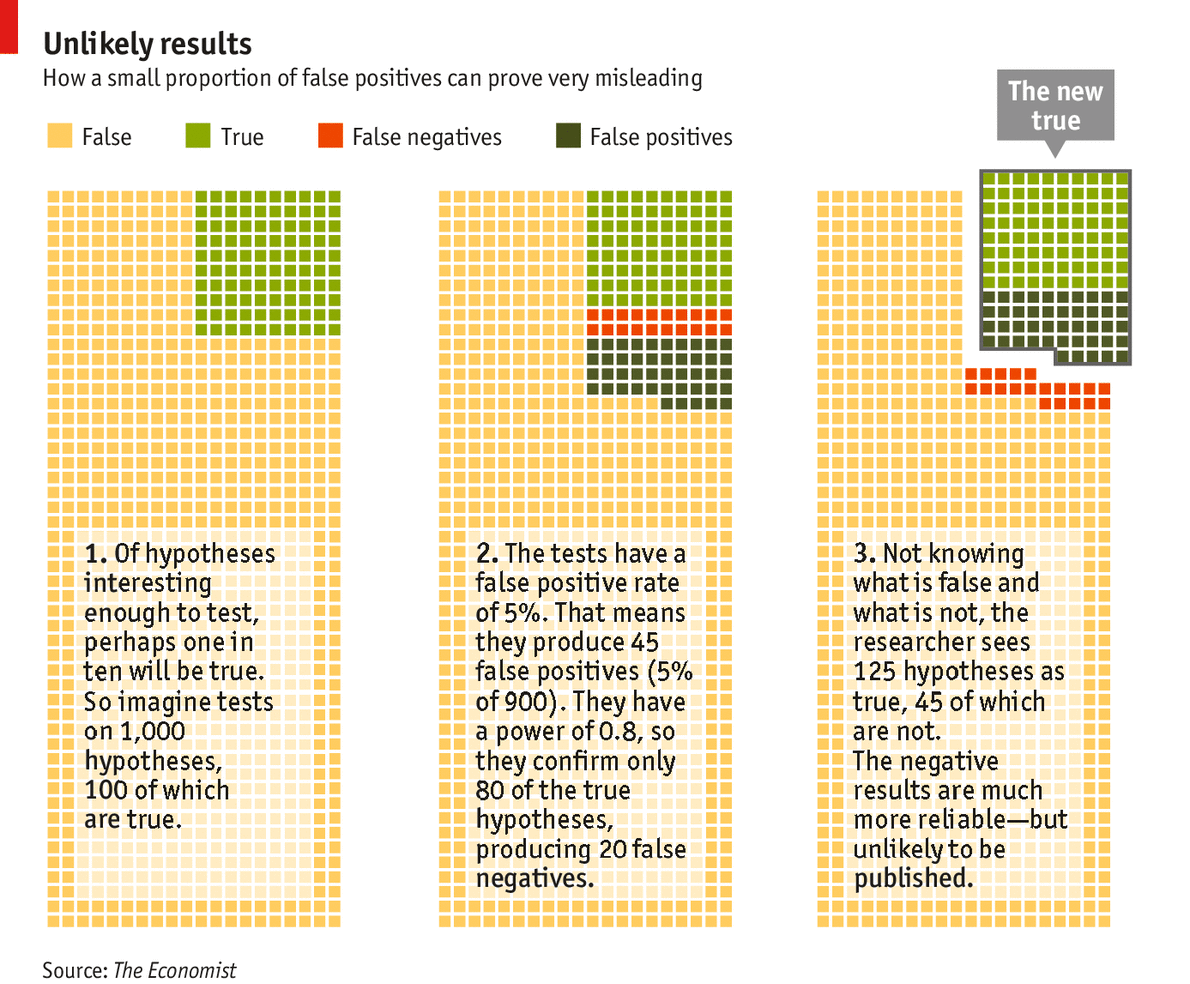
- Simple Statistics publishes A summary of the evidence that most published research is false and discusses why they believe there is very little evidence to substantiate that most published research is false.
- A new application of probability – Learning mathematics via Monte Carlo Methods.
- Naming Rules in R – dos and don’ts that will make your R code more elegant.
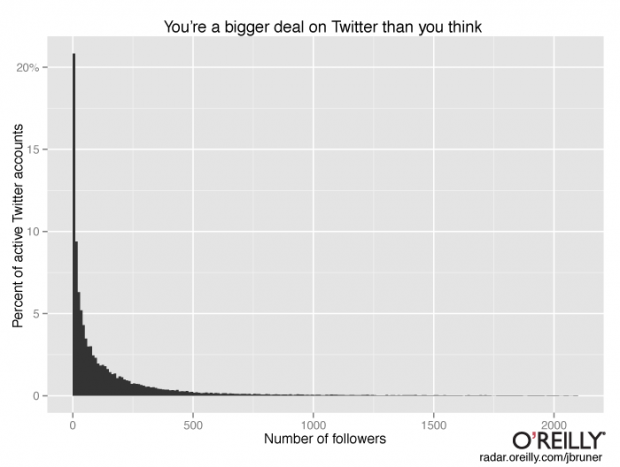
- Revolution Analytics conducts a study with a random sample of 400,000 active Twitter handles, and displays the distribution of the number of Twitter followers. Do you want to know where you rank by the number of followers?
- And finally, the R User Conference, useR! 2014 is scheduled for July 1-3, 2014 at the University of California, Los Angeles. If you would like to submit a proposal for a three hour tutorial on a special topic regarding R, please contact the organizing committee before January 5, 2014.
Uncategorized
23
Dec 13
The week in stats (Dec. 23rd edition)
16
Dec 13
The week in stats (Dec. 16th edition)
- For those who love the TV show CSI: Crime Scene Investigation, a tutorial on how you can detect traces of data fraud using R.
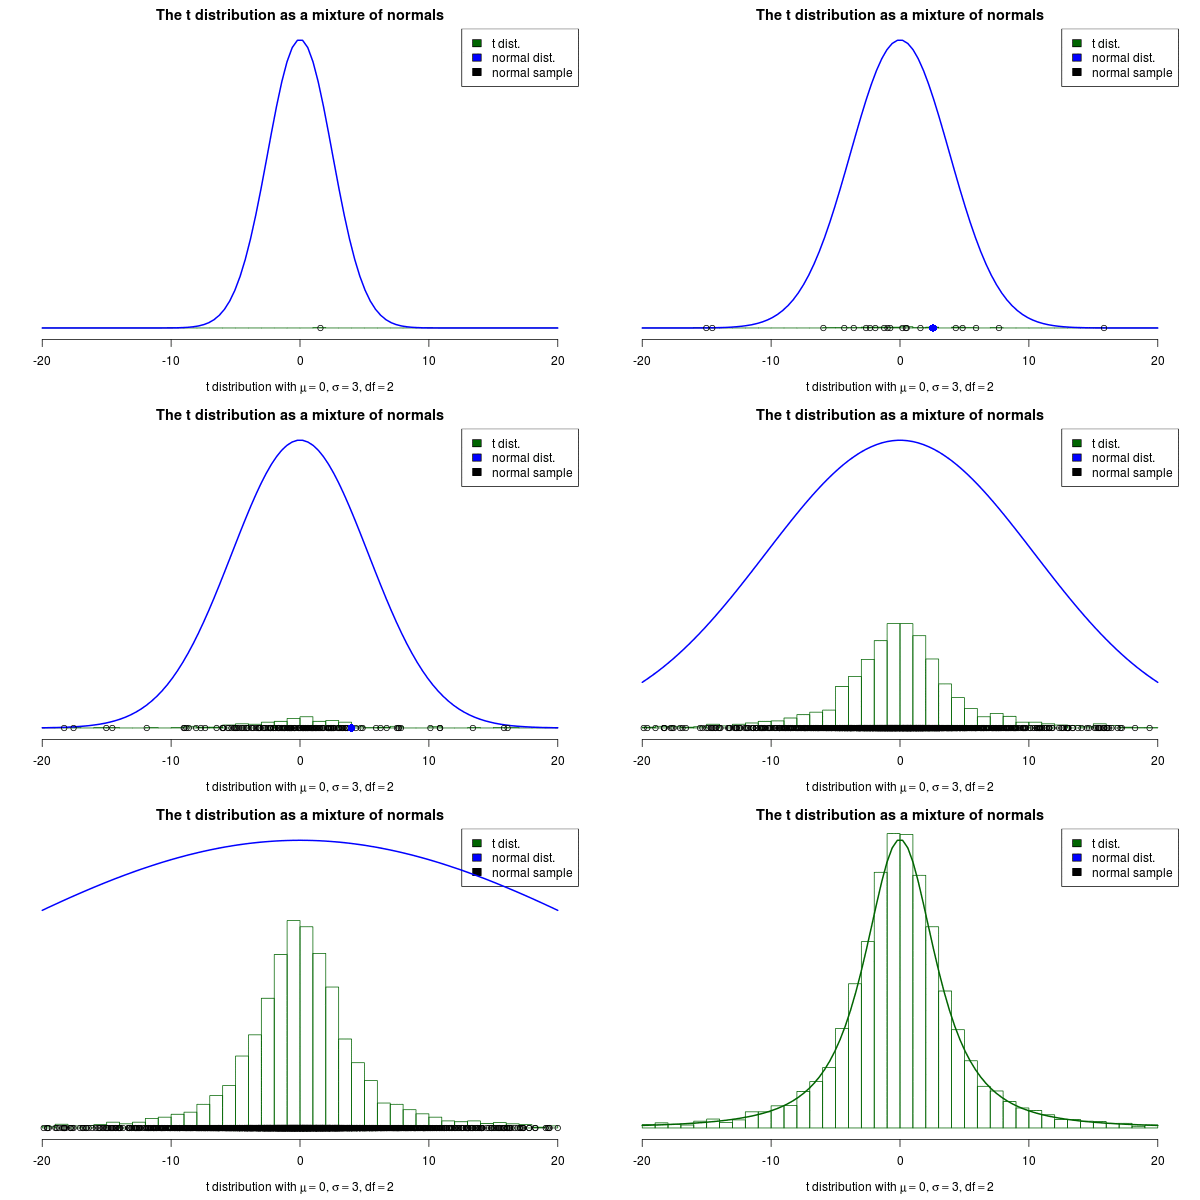
- Did you know that a t-distribution can be written as a mixture of Gaussians? Here how it works.
- PirateGrunt continues his series “24 Days of R”.
- etcML is an online text classification startup (advised by Andrew Ng of Stanford University) that helps answer questions like, Is your favorite sports team is popular on Twitter? Or, Is your kickstarter proposal is written for success?
- A tutorial on how to use matrix factorization to analyse social network graphs.
- Revolution Analytics conducts an analysis on R packages and found over 30 R packages require 10 or more prerequisite packages (with SISUS requiring 19), while most packages have 3 or less dependencies.
- And finally, if you flip a fair coin 100 times, what is the probability that you will get 60 or more heads?
10
Dec 13
Prize for statistics students?
In order to promote work on statistical simulations, as well as thinking about deeper issues in data analysis, I’m considering starting a prize for students.
Here are my ideas:
* One prize would be for the most innovative use of Monte Carlo methods to model a problem in pure or applied statistics. This prize would be offered in two divisions: undergraduate and graduate.
* One prize would be for an essay that explores the foundations of probability theory or statistics with an emphasis on epistemological issues. This would be open to all students.
* Prizes would be in the $3,000 – $6,000 range.
* The judging committee would be drawn from professors, students and industry.
What are your thoughts? Specifically:
* If you’re a student, is this something you’d apply for?
* If you’re a professor or instructor, do you think your students would be interested in this? Would you pass along the information to them?
* If you represent a company, could you see advantages to sponsoring one of the prizes?
* What changes or suggestions do you have?
9
Dec 13
The week in stats (Dec. 9th edition)
- The problems with using a p-value as a fixed cutoff for hypothesis testing are well known. Probabilities and P-Values is another article that discusses the weakness of the p-value. However, like every author who claims the p-value is horrible, no one is able to produce a satisfactory substitute.
- PirateGrunt is currently producing a series of 24 articles called 24 Days of R. In every post, he shares a few neat R tricks and explains how you can use them. You may find his first post here and the subsequent ones in his blog.
- Coursera – an online education startup – has rapidly expanded its curriculum of statistics and data analysis courses. There are now 33 modules directly linked to the field, excluding the courses where statistics and data science are used as a supportive tool (e.g. finance). These courses make use of multiple statistical software packages like Python, MATLAB and of course R. Here’s the complete list of Coursera courses using R, ranked by “popularity”.
- For those interested in machine learning, a preview of Data Mining Applications with R by Yanchang Zhao and Yonghua Cen is available here.
- A tutorial on the R package Plotly, and how to make beautiful visuals and graphs with it.
- A recent article by Matt Asay claims that “Python is displacing R as the language for data science.” David Smith of Revolution Analytics discusses his thoughts on the competition of R and Python.
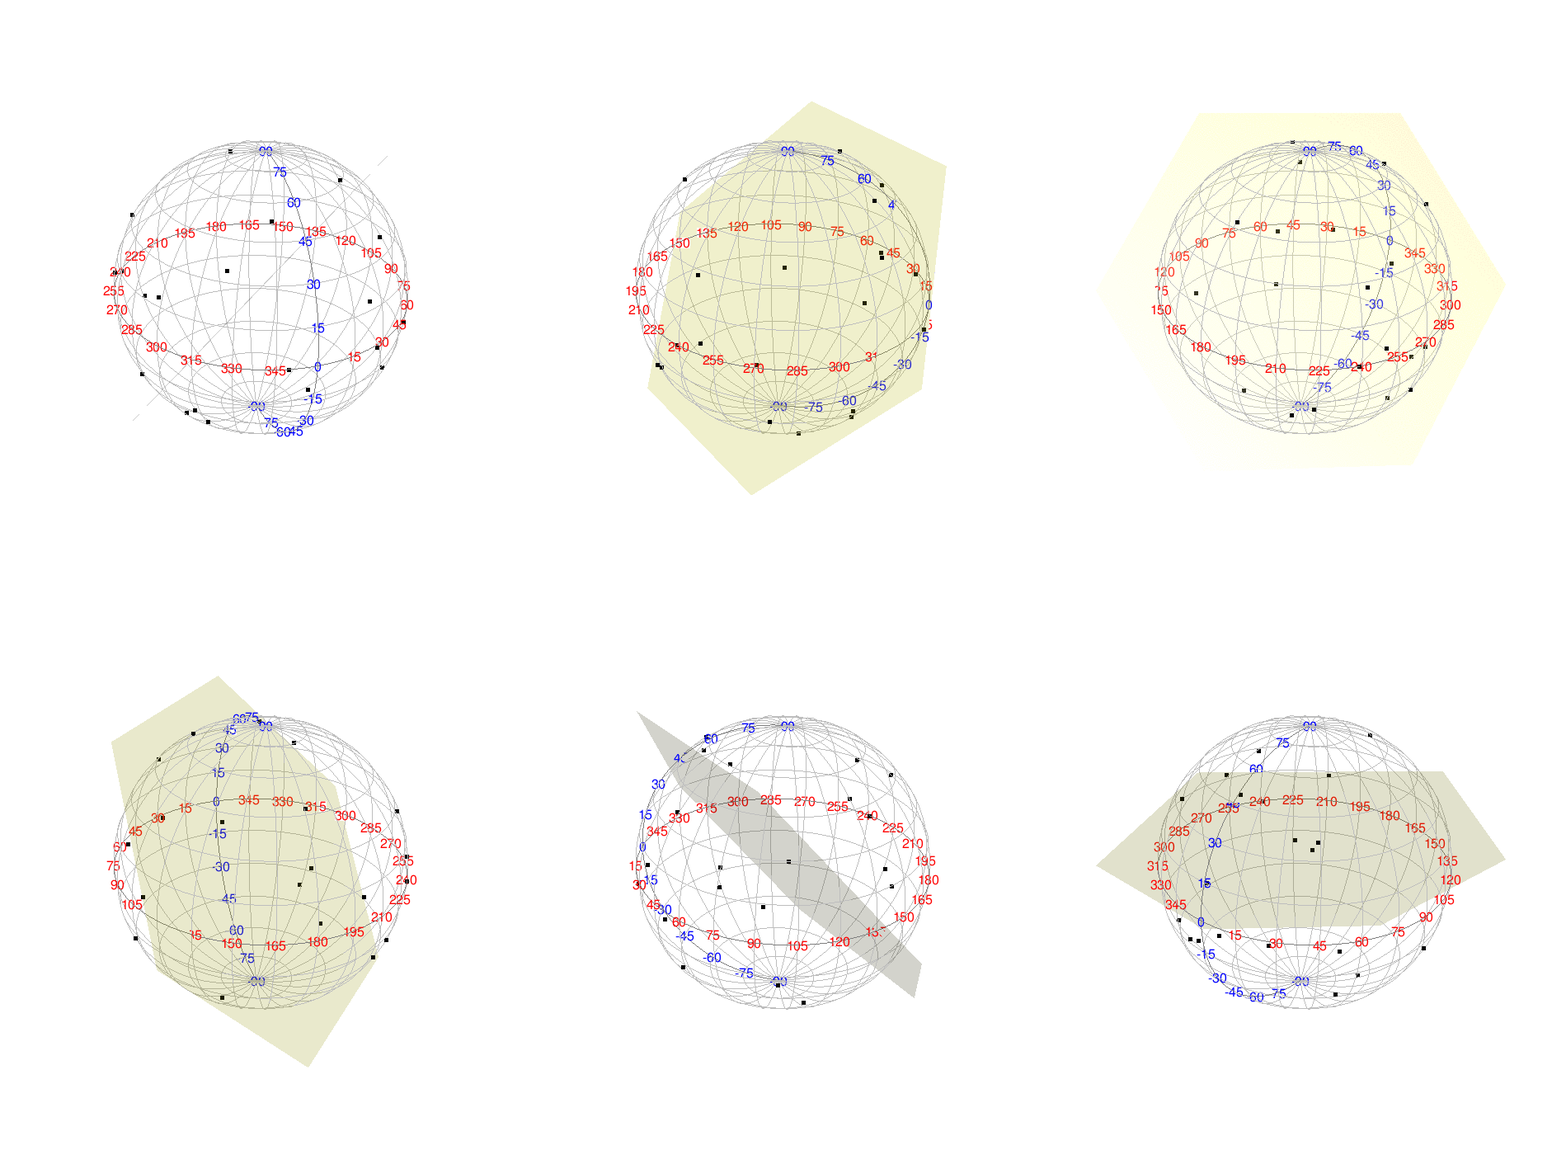
- Consider n points uniformly distributed on a sphere. What is the probability that all points lie on a same hemisphere (not necessarily the north or south hemisphere)? Arthur Charpentier of Freakonometrics presents a simulation-based solution, along with some very nice visuals.
25
Nov 13
The week in stats (Nov. 25th edition)
- Revolution Analytics’ David Smith presents a 51 minute video webinar called “What Data Science can learn from small-data Statistics“
- R-fiddle.org is an early stage beta that provides you with a free and powerful environment to write, run and share R-code right inside your browser. You might want to read the following tutorial, by DataMind, before you start playing with it.
- An article on R and Bayesian Statistics discusses several popular R packages for Bayesian computations, including WinBUGS (Bayesian Inference Using Gibbs Sampling), JAGS (Just Another Gibbs Sampler) and Stan (named after Stanislaw Ulam of Monte Carlo fame), as well as some sample code and outputs.
- The Laplace Approximation is a useful way for approximating distributions and is frequently, but not exclusively, used to compute posterior distributions. Did you know that it can be carried out in a super easy way, in just four lines of code?
- And finally, for those Stata users, here are some quick ways to turn your Stata knowledge into R knowledge.
18
Nov 13
The week in stats (Nov. 18th edition)
- Aurther Charpentier of Université de Rennes I (aka Freakonometrics) presents a technical post on Maximum Likelihood versus Goodness of Fit, and simulation studies with the Gamma and Lognormal distribution.
- Martin Johnsson wrote a series of five well-written tutorials called A slightly different introduction to R, with tips for beginner R users. Here are the links to parts I, II, III, IV and V.
- Three hunters fire simultaneously at a boar and exactly one bullet hits the animal. Given that they have accuracies 20%, 40% and 60%, what are the probabilities of each hunter hitting the boar?
- Last week, many helpful R articles attracted attention from readers. Two very useful articles that can help advanced R users to reduce their R computation times: Understanding how memory works in R, and Faster for() loops in R, and three on data visualizations: Visualizing neural networks in R, ggplot2: Cheatsheet for Scatterplots and Visualizing Structure in Topic Models.
- Andrew Gelman of Columbia University discusses why statistics is the least important part of data science
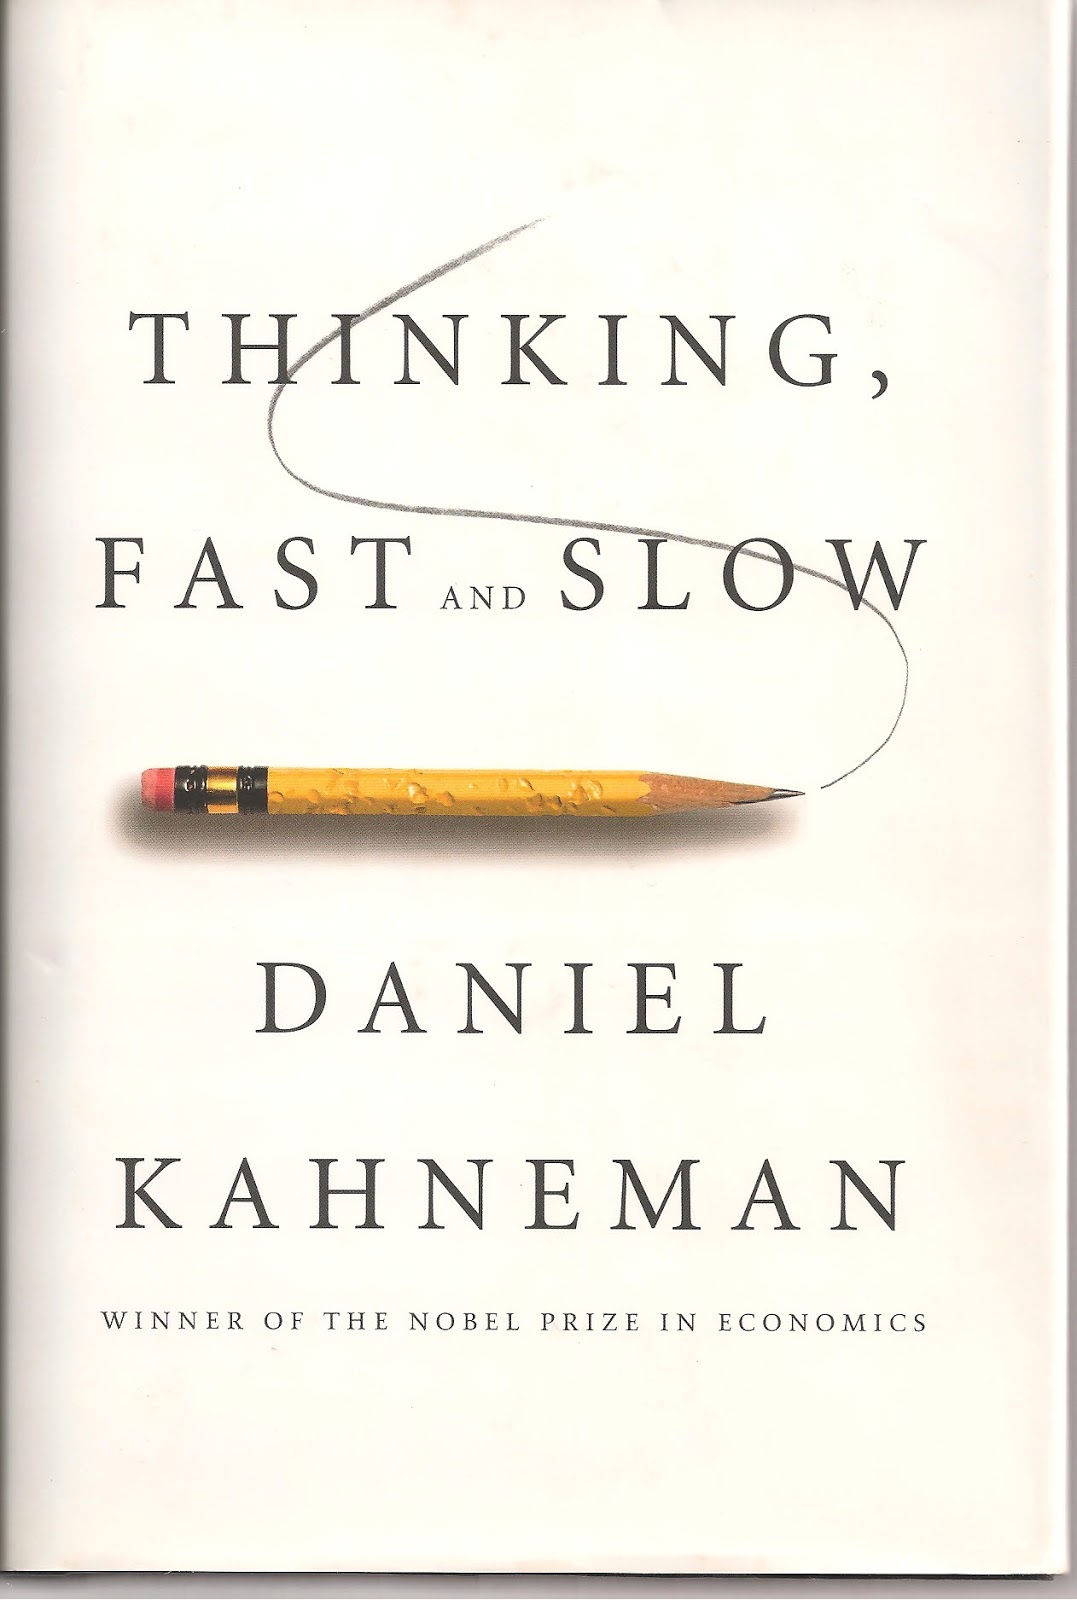
- And finally, a book review of Thinking, Fast and Slow by Daniel Kahneman (winner of the 2002 Nobel Prize in Economics), reviewed by Patrick Burns. You might also want to read my own thoughts on the dismal state of behavioral economics.
11
Nov 13
The week in stats (Nov. 11th edition)
- Tableau has become a star in the Business Intelligence/Analytics world for its data visualizations. Yet, you can get even more out of Tableau if you integrate it with R. If you also use SQL, here is a tutorial for you on SQL, R and text analysis.
- Bad breaks, then flatlines. Good holds steady.
- Andrew Gelman offers his thoughts on the term marginally significant, which is commonly used but often misleading.
- A list of finance data sources which can be accessed directly using R. This is a must for quants, financial analysts and traders.
- Professor Vivek H. Patil of Gonzaga University describes some R visualization techniques using base R, ggplot2, and rCharts.
- Christian Robert, of Universite Paris-Dauphine, aka Xi’an, discusses his views on an article from The Economist about statistical significance and why many published research papers are unreproducible.
4
Nov 13
The week in stats (Nov. 4th edition)
- The Beauty of Mathematics, visually explained in 101 seconds.
- The R package texreg allows you to combine the output tables of many different types of regressions into one big table, so that you can easily see which ones are more useful.
- A tutorial that compares the exact and normal approximations for 95% binomial confidence intervals, and why we should always use normal approximations for binomials with large trials.
- Statistics + Journalism = Data Journalism? If you are interested in this new hybrid field, check out the new MOOC course Doing Journalism with Data: First Steps, Skills and Tools offered by 5 leading experts including the Pulitzer Prize winner Steve Doig starting in 2014.
- And finally, some weekend readings on statistics and econometrics recommenced by Prof. Dave Giles of University of Victoria.
28
Oct 13
The week in stats (Oct. 28st edition)
- Arthur Charpentier of Freakonometrics discusses GLM, non-linearity and heteroscedasticity.
- A statistical analysis of the popular TV show “How I Met Your Mother” based on IMDB user ratings. As you may recall, diffuseprior did a similar analysis for The Simpsons earlier this year.
- Christian Robert of Universite Paris-Dauphine, aka Xi’an, has a two part review of Machine Learning, A Probabilistic Perspective by Kevin P. Murphy.
- A very short tutorial on how to estimate the number of visitors to a website accurately when some of them have “cookies” disabled.
- For those interested in quantitative finance, here’s a list of blogs to bookmark for future reference.
- New to R? Bright North Lab shares a beginner’s experience of learning R – from basic graphs to performance tuning.
- Here at StatisticsBlog, Matt Asher wrote about The disgrace of the mandatory census and judicial cowardice in the trial of Audrey Tobias.
22
Oct 13
The disgrace of the mandatory census
In 2011, Audrey Tobias refused to provide Statistics Canada with a filled out copy of her census form, as mandated by law. Her decision, and her decision to stand by that decision, led to a trial in which the 89-year-old faced jail time. Although Tobias stated that her act was protest against the use of US military contractor Lockheed Martin to process the forms, and not against the mandatory nature of the census itself, this was really a trial of the government’s power to compel citizens to provide it with private information. As Tobias’ lawyer, Peter Rosenthal, argued, compelling Tobias to fill out the form on threat of jail was a violation of the Canadian Charter of Rights, and its provisions for freedom of conscience and expression.
The judge in the case, Ramez Khawly, rejected Rosenthal’s argument, but found a way to find Tobias not guilty anyway on the basis of his doubt about her intent in not filling out the form. Perhaps sensing the outrage that might ensue over punishing an octogenarian for a non-violent act of civil disobedience, Khawly was nevertheless too fearful, or obtuse, to uphold an argument that would set a highly inconvenient precedent from the standpoint of the state. The judge both justified and exposed his particular mix of cowardice and compassion by asking, “Could they [the Crown] not have found a more palatable profile to prosecute as a test case?”
I suppose I shouldn’t be surprised by the judge’s politically expedient decision. What shocks me is the reaction of many regular citizens, and in particular of some fellow statisticians. Let me be as clear as possible about this: support for the mandatory census is a moral abomination and a professional disgrace. It should go without saying that informed consent is a baseline, a bare minimum for morality when conducting experiments with human subjects. Forcing citizens to divulge information they would otherwise wish to keep private, on pain of throwing them in a locked cage, does not qualify as informed consent!
There is no point here in arguing that what’s being requested is a minor inconvenience, or an inconsequential imposition. Informed consent doesn’t mean “what we think you should consent to.” More than anything else, statistics is about understanding the inherent uncertainties in measurement, prediction, and extrapolation. Just because you might not object to answering certain questions, gives no reason to assume the universality of your preferences. Finally, note that to at least a small group of revolutionaries, the right not to divulge certain information to authorities was so important that it was written right into the Bill of Rights.
Besides the argument that the census in minimally invasive, I’ve also heard it argued that the value of obtaining complete data outweighs concerns of privacy and choice. To this I say that our desire, as statisticians, for complete and reliable data, isn’t some ethical trump card, nor is it the scientific version of a religious indulgence that purifies our transgressions.
Dealing with incomplete and imprecise data isn’t some unique problem that can be overcome at the point of a gun, it’s the very heart and soul of statistics! In the real world, there is no such thing as indisputably complete or infinity precise data. That’s why we have confidence intervals, likelihood estimates, rules for data cleaning, and a wide variety of sampling procedures. In fact, these sampling procedures, if properly chosen and well executed, can be more accurate than a census.
I call on all those who work for StatsCan or other organizations to refuse to participate in any non-consensual surveys, to stand up for their own good name and the good name of the profession, and to focus their energies on finding creative, scientifically sound, non-coercive ways to obtain high quality data.

