probability


15
Oct 15

Random samples in JS using R functions

For a JavaScript-based project I’m working on, I need to be able to sample from a variety of probability distributions. There are ways to call R from JavaScript, but they depend on the server running R. I can’t depend on that. I need a pure JS solution.

I found a handful of JS libraries that support sampling from distributions, but nothing that lets me use the R syntax I know and (mostly) love. Even more importantly, I would have to trust the quality of the sampling functions, or carefully read through each one and tweak as needed. So I decided to create my own JS library that:

  • Conforms to R function names and parameters – e.g. rnorm(50, 0, 1)
  • Uses the best entropy available to simulate randomness
  • Includes some non-standard distributions that I’ve been using (more on this below)

I’ve made this library public at Github and npm.

Not a JS developer? Just want to play with the library? I’ve setup a test page here.

Please keep in mind that this library is still in its infancy. I’d highly recommend you do your own testing on the output of any distribution you use. And of course let me know if you notice any issues.

In terms of additional distributions, these are marked “experimental” in the source code. They include the unreliable friend and its discrete cousin the FML, a frighteningly thick-tailed distribution I’ve been using to model processes that may never terminate.


30
Jan 14

Probability Podcast

I’ve produced a pilot episode of a “Probability Podcast”. Please have a listen and let me know if you’d be interested in hearing more episodes. Thanks!

The different approaches of Fermat and Pascal
Pascal’s solution, which may have come first (we don’t have all of the letters between Pascal and Fermat, and the order of the letters we do have is the matter of some debate), is to start at a point where the score is even and the next point wins, then work backwards solving a series of recursive equations. To find the split at any score, you would first note that if, at a score of (x,x), the next point for either player results in a win, then the pot at (x,x) would be split evenly. The pot split for player A at (x-1,x) would be the chance of his winning the next game, times the pot amount due him at (x,x). Once you know the split in the case where player A (or B) lacks a point, you can then solve for the case where a player is down by two and so on.

Fermat took a combinatorial approach. Suppose that the winner is the first person to score N points, and that Player A has a points and Player B has b points when the game is stopped. Fermat first noted that the maximum number of games left to be played was 2N-a-b-1 (supposing both players brought their score up to N-1, and then a final game was played to determine the winner). Then Fermat calculated the number of distinct ways these 2N-a-b-1 might play out, and which ones resulted in a victory for player A or player B. Each of these combinations being equally likely, the pot should be split in proportion to the number of combinations favoring a player, divided by the total number of combinations.

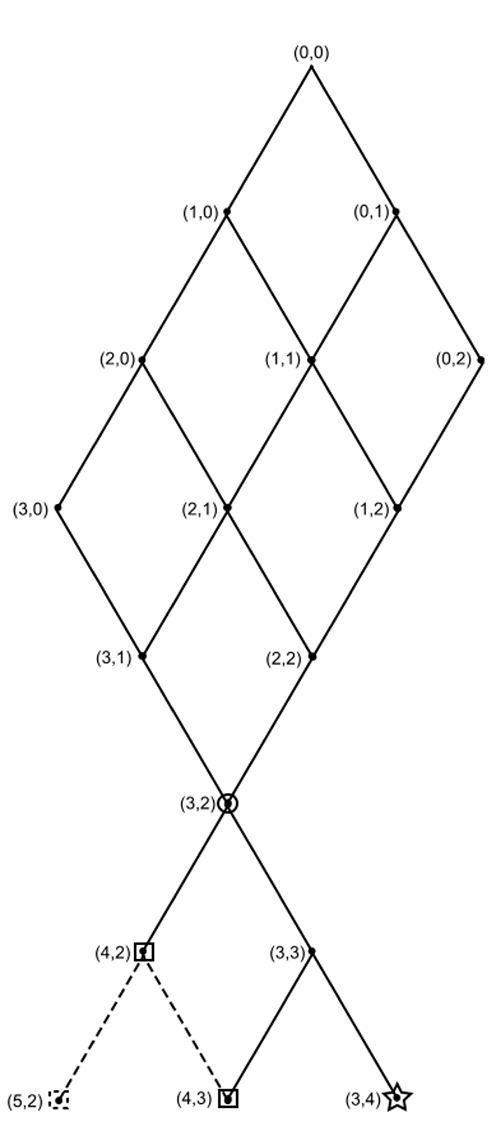
To understand the two approaches to solving the problem of points I have created the diagram shown at right.

Suppose each number in parenthesis represents the score of players A and B, respectively. The current score, 3 to 2, is circled. The first person to score 4 points wins. All of the paths that could have led to the current score are shown above the point (3,2). If player A wins the next point then the game is over. If player B wins, either player can win the game by winning the next point. Squares represent games won by player A, the star means that player B would win. The dashed lines are paths that make up combinations in Fermat’s solution, even though these points would not be played out.

Pascal’s solution for the pot distribution at (3,2) would be to note that if the score were tied (3,3), then we would split the pot evenly. However, since we are at point (3,2), there is only a one-in-two chance that we will reach point (3,3), at which point there is a one-in-two chance that player A will win the game. Therefore the proportion of the pot that goes to player A is 1/2+1/2 (1/2)=3/4 whereas player B is due 1/2 (1/2)=1/4.

Fermat’s approach would be to note that there are a total of 4 paths that lead from point (3,2) to the level where a total of 7 points have been played:

(3,2)→(4,2)→(5,2)
(3,2)→(4,2)→(4,3)
(3,2)→(3,3)→(4,3)
(3,2)→(3,3)→(3,4)

Of these, 3 represent victories for player A and 1 is a victory for player B. Therefore player A should get 3/4 of the pot and player B gets 1/4 of the pot.

As you can see, both Pascal and Fermat’s solutions yield the same split. This is true for any starting point. Fermat’s approach is generally agreed to be superior, as the recursive equations of Pascal can become very complicated. By contrast, Fermat’s combinatorial method can be solved quickly using what we now call Pascal’s Triangle or its related equations. However, both approaches are important for the development of probability theory.


31
Jul 13

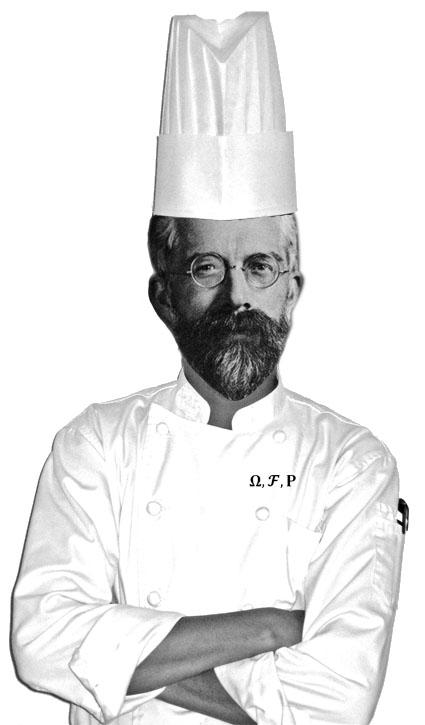
A probability cookbook

Randomness – Probability = Chance

Chance – Randomness = Fate

Fate + God = Predestination

Probability + Epistemology = Types of Randomness

Subjective Probability = Betting + Coherence

Propensity theory = Probability + Animism

Kolmogorov Axioms = Probability – randomness – chance

Probability + Complexity = Cryptography

Chaos + Ignorance = Randomness

Regression: Data = Signal + Noise

Bayesian:
Posterior = Prior [latex] \times [/latex] Likelihood
Prior + Data [latex] \rightarrow [/latex] Probability

Probabilitst:
Probability [latex] \rightarrow [/latex] Frequency

Statistical:
Frequency [latex] \rightarrow [/latex] Probability

Big Data:
Predictive value [latex] \gg [/latex] Model simplicity
High dimensions + Fast computers = De chao ordo


1
Jul 13

Morality needs probability, manifesto addendum

Just added to my Big Bright Green Manifesto Machine. You might need to read this through a couple times; it’s a difficult concept since it lives in a collective blind spot for us:

Doing ethics without probability is like performing surgery with a wooden spoon — it’s a blunt instrument capable of only the most basic operations, and more likely to kill the patient than heal them. Implicitly, we understand this need for probability in making ethical judgements, yet most people recoil when the calculus of probabilities is made explicit, because it seems cold, because the math frightens and confuses them, or because letting odds remain unestimated and unacknowledged allows people to confuse positive outcomes with moral behavior, sweeping hidden risks under the rug when things go well, or claiming ignorance when they don’t. It’s time to acknowledge — directly, explicitly, mathematically — that morality needs probability. For ethics to move forward it must be integrated with our knowledge of randomness and partial entailment.

Here’s an example of how we already take probability into account implicitly. If we retrieve our lost ball from someone’s yard without asking first, we justify this based on our belief that the owner is more likely to be bothered by us interrupting their dinner, than by our temporary trespass on their lawn. The greater the probability of great harm, the higher the level of certainty we demand. Our most heated debates involve situations where the probability of harm from both action and inaction is high. If someone’s dog is stuck in a hot car on a sunny day, should you break in and try to save it? Does the chance of a dog dying of heatstroke justify a forced entry that will probably result in expensive damage and an irate owner (though it’s possible they would be grateful instead). If you decide to break in, how long should you wait first? What prior distribution should you put on the owner’s return time, and how do you update your prior as time goes by? If the waiting time is chi-square on low degrees of freedom, your concern for the dog might be unjustified. If it follows the unreliable friend distribution, you may be that dog’s only hope.

As I hope is becoming clear, questions of morality cannot be resolved without asking questions about probability. If the example above seems trivial (perhaps the owner’s property rights trump your concern for a dog), then substitute the animal for a toddler who looks uncomfortably warm. Now how long do you wait, and how do you deal with the risk that smashing a window might harm the child?


21
May 13

What are the chances this headline will still be true in 10 years?

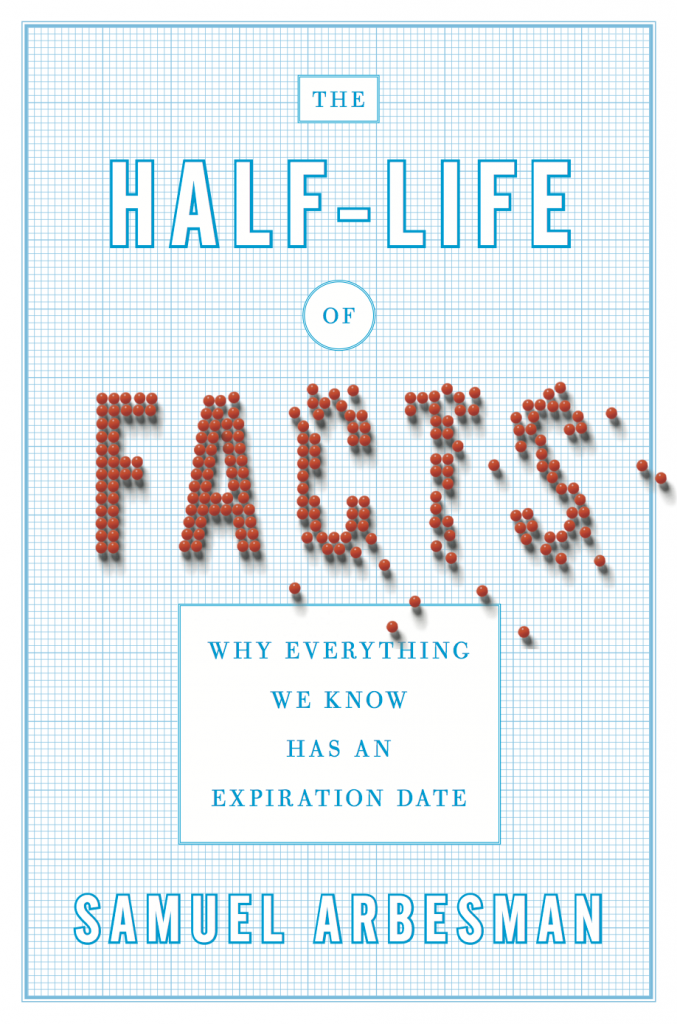
In this post I’ll be discussing the ideas presented in The Half-Life of Facts, by Samuel Arbesman. The book argues that facts, which we often take to be iron-clad, unchanging laws of the universe, are regularly discovered to be false or replaced by updated versions. He argues that while it’s impossible to predict in advance how long a particular fact will endure, in aggregate truth values decay at stable rates. In effect, Arbesman is proposing a kind of Law of Large Numbers for belief.

Arebesman’s thesis, I should say right up front, is highly appealing to me. It fits my belief that all facts are, to some extent, fuzzy, uncertain, contingent, and most importantly prone to revision over time as new information comes in. Of course, some facts, or categories of facts, are more likely to be revised than others. What I hoped to get from Arbesman’s book was a deep analysis of why some facts (or fictions) last longer than others, and how you might quantify different categories of facts from the viewpoint of survival analysis.

What are facts?
Arbesman defines facts as “individual states of knowledge awareness.” His main way of subdividing facts is on the basis of how quickly they change, from those constantly in flux (the current weather) to the very stable (the number of continents). In between are what Arbesman calls “mesofacts,” those which change at an intermediate timescale. Most of our scientific knowledge fits in this category.

When I mentioned the continents, you may have wondered whether I was referring to the number of huge landmasses on earth (a slow-changing fact, by any measure), or what we consider to be a continent. For example, if scientists decide that Madagascar or Baffin Island should be called a continent, the quantity of large land-masses on earth hasn’t changed.

Brawndo, the thirst mutilator!
This may seem like an obvious distinction, but it’s one that Arbesman fails to make. He conflates facts about the earth with nomenclature, confusing words with objects. The worst example of this confusion occurs in the chapter on how facts spread. Arbesman explains how we came to use the word “brontosaurous” for what, by scientific convention, should be called “apatosaurus”, as this name came first. Here the “fact” that changed doesn’t really have anything to do with the nature of dinosaurs, it has to do with the name we’ve decided to give it (which is, of course, a matter of convention, and arbitrary). To Arbesman, though, this issue of nomenclature becomes an “erroneous” fact which has “sadly” persisted for way to long.

The conflation of semantics and understanding allows Arbesman to hide a normative decree in a linguistic assessment. If my explanation of the confusion between the descriptive and prescriptive is, itself, confusing, consider Mike Judge’s wonderful illustration from the film Idiocracy. The main character tries to explain to the people of the future that their plants are dying because they are being irrigated with Brawndo, a sport drink. Here’s how their conversation goes:

Arbesman’s failure to draw a line around what are facts, and what aren’t, leads to even deeper confusions. Making this distinction clear would be, no doubt, a very difficult task. But instead of attempting it, and risking falling into “an epistemological rabbit hole,” Arbesman’s shrugs and paraphrases the supremely weasely Supreme Court Justice Potter, who said that no precise, legal definition of pornography was needed, because “I know it when I see it.”

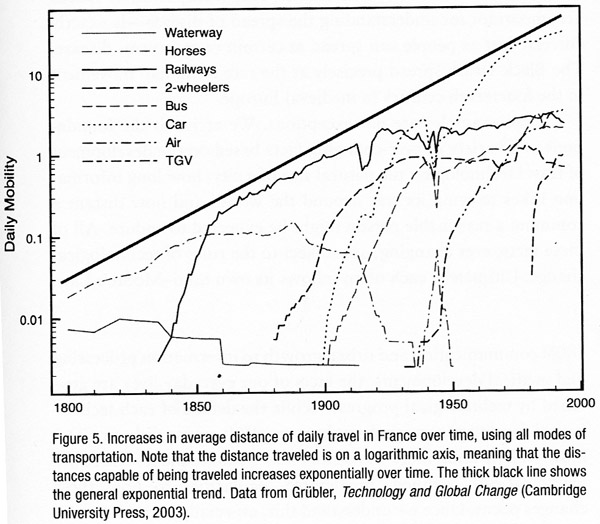
Without a line (however fuzzy) drawn around his subject, Arbesman quickly wanders off from an insightful discussion of the decay rate of information in physics, medicine and scientific models in general, to a broad discussion of the things in our world that change. This transition is completed in the chapter titled “Moore’s law of everything,” in which Arbesman compares exponential growth in computing power to other technologies with accelerating levels of change, like transportation. At this point it’s no longer clear which are the facts under consideration. Is it the maximum number of transistors per chip? Is it our model of how technology changes? Or is it the rate of change of change itself?

Is change a constant?
This last question might be the most interesting one of all. More clearly stated, what is the derivative of the half-life of facts, for a given category? And even one more step beyond, are these derivatives themselves stable? I want to know what the evidence says. Are medical facts becoming obsolete faster than ever? Has our knowledge about basic physical concepts like inertia begun to solidify? Arbesman hints at these questions, but just barely. I was very disappointed by his lack of rigor and quantification. Perhaps this field of study still needs it’s Darwin or John Graunt, someone willing to spend years or decades compiling and analyzing the minutia how facts change, before coming up with a well-informed model of truth decay.

My own suspicion? The stability of a fact is proportional to how well the related field of study is established, and to how long that particular fact has been considered valid. Thus the lifespan of facts would be Weibull distributed, or have some variant of the Unreliable Friend distribution (more about that in a future post). Arbesman hints at this possibility when discussing the history of mathematical proof. He notes that the waiting time for a conjecture to be settled follows a heavy-tailed distribution, which makes it difficult to predict how much longer it will take for mathematicians to come to a conclusion about long-standing problems.

But even this attempt at a more nuanced view of half-lives hints at another problem with Arbesman’s incomplete taxonomy of facts, and his unwillingness to specify which facts we are discussing. In this case of mathematics, it seems at first that he might be referring to the underlying proposition itself. This leads me to wonder if Arbesman is positing (at least implicitly) a Schrödinger’s cat view of the mathematics, where Fermat’s Last Theorem (FLT) exists in a state of superposition, both true and false and indeterminate all at once, waiting for Andrew Weil to come along to open the lid, peer into the box, and declare it “true.” Another interpretation is that the fact being discussed is the social phenomenon; mathematicians went from believing that FLT was probably true but definitely unproven, to believing that FLT was indisputably true. Based on his initial definition in terms of awareness, I assume it’s the later. Unfortunately, no clarification is forthcoming, and Arbesman misses out on an opportunity to comment on the two most interesting twists in the FLT saga, especially from the point of view of evaluating “facts”. For one, Weil made a crucial mistake in his first official version of the proof, and for the other, Weil’s proof depends on a newer, and somewhat controversial, mathematical assumption (the Axiom of Choice).

Chart from The Half-Life of Facts showing the increase in transportation speeds over time.

The depths of shallowness
I suppose there’s a limit to how much depth we can expect from a general interest book. Still, I’m disappointed that the author seems to explicitly avoids discussing the basic, hard puzzles of knowledge: How close to the (real?) truth are the “facts” we are learning today? What is the probability that these will be later found out to be untrue? Does that probability go to one on a long enough timeline, and to what extent can we quantify that timeline.

Instead of rigorous analysis, Arbesman fills out his short book by rehashing famous stories from well-known research papers (if I have to read about the gorilla on the basketball court one more time, I just might go apeshit). We do get occasional bits of insight, usually in the form of quotes, like Lord Kelvin’s insistence that anything that can be measured, can be measured incorrectly, or John M. Smith’s quip that “Statistics is the science that lets you do twenty experiments a year and publish one false result in Nature.”

This last quote refers to the p-value, which Arbesman does a decent job of explaining, though I’m not sure he fully understands it. He quotes John Ioannidis saying that, “If a study is small, it can yield a positive result more easily due to random chance.” However, the use of a fixed p-vale cutoff generally ensures that the exact oppose is true (see this delightfully humorous video about “The power of the test”). The structure of hypothesis testing can be tricky, but since Arbesman is described on the book jacket as an applied mathematician, I’m not willing to grade him on a curve.

There’s one other confusion in Arbesman’s book that I feel compelled to point out, since it may just be the most insidious (and common) epistemological mistake of all: the conflation of facts, predictions, and models. Arbesman mixes them all together in a short passage. In describing computer simulation of a social network, he says:

“When [the researchers] ran this experiment, they discovered that weak ties aren’t that important to spreading knowledge. While weak ties do in fact hold the network together, much as Granovetter suspected, they aren’t integral for spreading facts.”

Did you catch that? Arbesman went from describing a model (in this case a computer simulation) that generated a prediction (about the spread of information), to asserting a fact about our world (weak ties “aren’t integral for spreading facts”).

Am I just being annoying, noxious, always lingering?
Am I’m being overly fussy (to use the nicer word)? Am I too focused on precise definitions and picky distinctions, at the cost of missing the bigger picture? I don’t think so. The history of scientific progress, and in particular statistics, shows a strong correlation between linguistic and taxonomic advances. We can look back and see how progress is stifled by a lack of common, well-defined terms. For example, some of the early attempts to understand probability disintegrated into confused debates that could have been avoided with a clear stating of terms. More recently, E.T. Jaynes resolved Bertrand Russell’s paradox of the random chord by explicitly defining the characteristics a “random” chord would need to have.

If Arbesman is sloppy with the details, can he at least get credit for presenting the broader story in context? To some extent, I think so. As a general tour of how facts change, there’s no mistaking the basic message: facts do change, and we can be particularly blind (or caught off guard) when it comes to changes which happen at a medium pace. I wish, though, that Arbesman had explicitly connected this broader story with what is, to me, the central lesson: all of our beliefs should come with a measure of doubt!

To understand this doubt mathematically, we use probability theory. To understand it in practice, we use a framework for statistical inference. There are a number of these frameworks available, each with its own strengths and weaknesses. Hume said we could never infer anything from anything, giving us a kind of historical “null hypothesis” of inference, one that’s been soundly rejected by the evidence of scientific and technological progress. Fisher and von Mises maintained that probability should be restricted to long term frequencies. Keynes and Jefferies spoke of subjective probabilities and degrees of rational belief. Jaynes viewed probability theory as an extension of logical deduction.

All modern approaches to inference share the assumption that knowledge is not static, and that empirical evidence provides partial information. Full certainty, to the extent that it exists at all, is to be found only in the very long run (mathematically speaking, at the infinite limit). As such, we need to recognize the provisional nature of all facts.


5
Mar 13

My favorite randomization device

My recent look at JavaScript as a contender for statistical modeling got me thinking about the different methods used to create random variates. All computers algorithms create Type 1 randomness, which is to say, completely deterministic once you either figure out the underlying algorithm or once you see every number in the algorithm’s period. Jumping outside of software to the hard world around us, it seems possible to create Type 2 or even Type 3 randomness, at least from perspective of an observer who can’t base their predictions on real-time analysis of the generating mechanism (ie, they can’t watch it tick).

My favorite example of a real-world solution to randomizing is shown in the video at top. More details about the construction of the device are here.

What’s your favorite (hardware or virtual) randomization device?


31
Oct 12

Recommendation of the week

“[I]f you have performed any statistical analysis that is more complex than calculating the mean and the standard deviation, you should perform the same analysis on noise to make sure that whatever effect you observe is indeed a unique feature of your data and not an artefact of the analysis.”

Found this one over at Stefan’s sieste blog. I couldn’t agree more, especially now that computers and big data sets entice us to make ever more complex models. Oh, and that’s not a bad thing! As I’ve argued, we’ll need to give up on simple, easy to interpret models in order to get more predictive power.

I’d go even more meta than Stefan and argue that you should re-test your entire model-creating process on noise (perhaps he meant this with his quote). If you started with a data set, then ran a stepwise variable selection algorithm, then added in a new non-linear term to get a better fit, do the same on noise, trying to get the best fit. Are you able to get a statistically significant result? Better still, run the same procedure on different types of noise, not just Gaussian White (I know, sounds like something you’d load into a syringe. Normality, the gateway drug?).


23
Feb 12

A classification scheme for types of randomness

We often speak implicitly of different types of randomness but neglect to name or categorize them. Consider this post to be a kind of white paper or rough draft on the division of randomness into five categories. If you start using these distinctions explicitly, even if only in your own head, I think you will find them highly useful, as I have.

Type 0: Fixed numbers or known outcomes

Type 0 randomness is the special case of randomness where the data are already known. Any known outcome, regardless of the process that generated it, is Type 0 randomness. Once known, it has become a constant. In terms of information conveyed, all Type 0 randomness has zero informational entropy (a measure of uncertainty), and all messages with zero entropy are examples of Type 0 randomness.

Type 1: Pseudo random.

Most computers generate random numbers by a deterministic process. An initial “seed” is picked using some environmental factor, like the microsecond timing of the CPU, and from there onward every number that follows is fully determined by the algorithm. These algorithms can be very good, in terms of producing sequences of numbers that have desirable qualities. Yet, if you know that the sequence comes from some variation of, say, the Mersenne Twister, then a single number or short sub-sequence might be enough to predict all the subsequent numbers. Even if you can’t guess at the underlying mechanism, algorithms like the Mersenne Twister eventually loop: once you’ve seen the whole sequence, all future numbers will be known exactly, and you will have Type 0 randomness.

Computer software isn’t the only source of Type 1 randomness. Card shuffling machines, if sufficiently precise in their operation, map each unique ordering of playing cards to a single final ordering. Learn how the machine works, and you will know how each initial ordering is transformed.

The key to Type 1 randomness is that it is fully reducible to Type 0, in principle. The data source is known to be determinate, but the code is yet to be cracked. With enough time, attention, or technical sophistication, the sequence can be fully mapped.

Type 2: Non-fully reducible

Most real world randomness, and in general the most interesting sources of randomness, are of Type 2. Data streams of Type 2 randomness are conditionally random in the sense that we are able to reduce the uncertainty related to them, but only up to a certain point. Our model predicts the value of some response variable based on the other data, and this prediction can be quite good. But with Type 2 randomness there will always be some uncertainty left over, conditional on us making the best prediction we can.

A typical example of Type 2 randomness would be predicting whether certain individuals will develop heart disease within the next 10 years. Without knowing any specifics about the individuals, it’s very hard to make accurate predictions. Once we know some basic data, such as age, sex, and weight, we can make a better prediction. Even more fine-grained detail — history of smoking, diet, exercise patterns — allow us to make even better predictions. Each study or experiment we do, if of sufficient quality, improves the predictions we are able to make. Yet the randomness is non-fully reducible in the sense that, no matter how good our prior information or model, we will never be able to predict with 100% certainty whether a person will develop heart disease.

Regression curves are attempts to understand Type 2 randomness by separating signal (the model, or conditionally determinant, part) and noise. Often this noise part is modeled with some maximum entropy distribution, like the Gaussian. This is our way of recognizing that beyond some limit, we can no longer reduce the randomness. There will always be some Type 3 randomness left over.

Type 3: Martingale random

One way to think about Type 3 randomness is to imagine a fair bet. If the true probability of an event happening is 1/2, then 1 to 1 odds make it martingale random. There’s nothing you can do to improve your expected return to above zero; nor is there anything you can do to decrease your exception to below zero. In a series of independent fair bets, strategy is irrelevant to expectation. Importantly, this doesn’t prevent you from adjusting the probability distribution for payoffs, if you are able to vary wager amounts and stopping times. For example, you could try the martingale betting strategy, which offers a high probability of making small gains in exchange for a small chance of catastrophic loss.

Martingale randomness implies that there is no disconnect between the “advertised” distribution and the true (or revealed) distribution. The theoretical “fair coin” you meet in textbooks is martingale random. Of course you have to be very careful in how you interpret the results of a real coin toss in terms of informational content. Maybe it isn’t martingale random after all!

Type 3 randomness is not limited to situations in which you have two equally probable outcomes. Anytime you are unable to reduce randomness beyond a particular limit of predictability, what’s left over is martingale randomness. In fact, through a process of “whitening,” signals that generate non-uniform randomness can be converted into uniform randomness. The opposite can be accomplished as well (though I’ve never heard it called “blackening”).

Type 4: Real randomness.

This is the real thing: baked-in, irreducible randomness. For a data source to be Type 4 random, it must be martingale random and it must come from a sequence that is not only unknown, but a priori unknowable. If Type 4 randomness exists, then God plays dice; randomness is “baked in” to the universe.

I suspect that if Type 4 randomness really does exist, then it will be impossible to prove.

General thoughts on types and some examples

The most important thing to note about these categorizations is that the type of randomness depends on your perspective. The cards you hold in your hand are Type 0 randomness to you, but to the person sitting across the poker table from you, they are Type 2 randomness. Your opponent can use any number of tools to try and do better than pure chance at guessing your hand (how much you bet, the look in your eyes, and of course the cards they hold). The type of randomness you perceive is a function of what you know.

All degenerate random variables (i.e. the indicator function for the entire sample space, which is always 1) are Type 0 randomness.

Most of the games we play have some element of Type 2 randomness. Kids will play games with Type 1 randomness, like War, which is deterministic for any given card shuffling, and could in theory be mapped out. Type 1 randomness can still be surprising to you, but if there is any skill involved it would have to be Type 2 randomness: entropy reducible in theory.

The concept of Type 3 randomness is connected with two important statistical concepts: sufficiency and coherence. Once you know the sufficient statistics from a data source (and, vitally, assuming your model about the data is correct), threre’s nothing more you can do to improve your confidence intervals or ability to make predictions. For example, if you know that your data source has a Poisson distribution and the points are uncorrelated, then once you know the mean, there’s no other piece of information that can improve your ability to predict new values from the distribution. Broadly speaking, martingale randomness satisfies the de Finetti conditions of coherence, in that odds assignments must match up with known probabilities, and internal consistency needs to be maintained.

If your dice are loaded, then you’ve got a generator of Type 2 randomness. Over time, you can make better and better predictions about how often the different numbers will come up. But you still won’t be able to predict, with certainty, the results of any given roll. If somehow you knew the exact probabilities for each face, then you could use these dice as a generator of Type 3 randomness.

In a sense, the very first number generated by your computer’s random number algorithm is martingale random. There’s no way, unless you know how the seed is generated from the CPU’s timing and can “see” the microseconds tick by, to predict the range in which that number will fall with greater accuracy than would be expected by chance alone. On the other hand, it could be argued that the decimal part of the CPU’s clock isn’t really uniformly distributed. There will be some slight bias towards lower numbers, which is natural for any distribution of numbers that “grows” in size, even if it cycles (see Benford’s Law, and note that it applies not just to the first digit of a number, but to secondary digits as well). With enough careful investigation, you might be able to convert that first seeded random number into a case of Type 2 randomness.

Type 3 randomness is the holy grail of randomization. Casinos want dice which are perfectly symmetric in weighting, and resistant to wear and tear that might cause bias. Assignments to treatment in a clinical trial should strive for martingale randomness. Failure to achieve martingale randomness, when it is required, can have highly negative consequences.

“Beating the house” at a casino involves turning Type 3 randomness into Type 2 randomness, with enough usable signal left to overcome the casino’s inherent advantage. Strategies like analyzing roulette spins to find bias, and most famously counting cards, have been successfully used. One group of geeks was able to turn the randomness of a Vegas lottery machine which followed a Type 1 sequence into Type 0. They made the tactical mistake of hitting two huge jackpots in a row, tipping off the casino that they had successfully cracked the code. From the casino’s perspective, you have an inverse classification problem: given how well players are doing, what can you infer about the type of randomness they are detecting? Those jackpot-winning geeks could have taken a lesson from code breakers in WWII, who thought carefully about how to use the information contained in the cracked messages without showing the Germans that their code had been broken and that the allies understood their messages as more than the white noise of Type 3 randomness.

Because what separates the Types is our knowledge, randomness can come from a generation process that is completely deterministic and known to others (Type 0). As far as I’ve been able to tell, the digits of pi (beyond the ones you have memorized) are martingale random. If I give you a sequence of digits, and tell you they come from somewhere after the trillionth digit of pi, and let you use any tools you want short of a computer, there’s nothing you could do in a single lifetime to predict additional digits with an accuracy greater than 1/10th. Note that while the tail digits of pi appear to be a source of martingale randomness, not all irrational (or even transcendental) numbers have unpredictable digits. As counterexamples, see Louisville’s or Chapperhorn’s numbers. Any data source of Type 2 or greater must be incompressible, in the sense that if the sequence has infinite length, no finite-length description of it can exist. If there were a finite-length algorithm that could re-create (or predict) the sequence, then it’s at most Type 1 randomness (until we figure out this algorithm, if need be by iterating over all possible algorithms, starting with the shortest, until we get there).

I’ve tried to make these categorizations as clear as possible, but there are still edge cases which are hard to place. As is always the case, the closer you look, the fuzzier things get. However, I think you will still find this categorization of randomness to be quite useful, especially as a tool to discuss edge cases. Consider for a moment Chaitin’s Omega, which is the probability (weighted by string length) that a given computer program, run in a fixed computing environment, halts. The first few digits of Omega, determined by very short programs which instantly halt or loop, are easy to figure out. But we know from Turing that the halting problem is, in general, undecidable. So at some point, the digits of Omega become unknown and unknowable. Nor can we know when they become unknowable! The digits of Omega make the transition from Type 0 randomness (known) to Type 1 randomness (we just need to run the programs and see if they halt or loop), to Type 2 randomness (we may be able to set upper and lower bounds for the next few digits, or make a likelihood prediction based on reasoning and past experience), to Type 3 randomness (only God could predict the 10,000th digit with better than chance accuracy) and perhaps, almost frighteningly, to Type 4 randomness (God’s in a back alley, shaking up the dice right now).

3
Dec 11

The first thing you learned about probability is wrong*


*or dangerously incomplete.

I’ve just started reading Against the Gods: The remarkable Story of Risk, a book by Peter Bernstein that’s been high on my “To Read” list for a while. I suspect it will be quite interesting, though it’s clearly targeted at a general audience with no technical background. In Chapter 1 Bernstein makes the distinction between games which require some skill, and games of pure chance. Of the latter, Bernstein notes:

“The last sequence of throws of the dice conveys absolutely no information about what the next throw will bring. Cards, coins, dice, and roulette wheels have no memory.”

This is, often, the very first lesson that gets presented in a book or a lecture on probability theory. And, so far as theory goes it’s correct. For that celestially perfect fair coin, the odds of getting heads remain forever fixed at 1 to 1, toss after platonic toss. The coin has no memory of its past history. As a general rule, however, to say that the last sequence tells you nothing about what the next throw will bring is dangerously inaccurate.

In the real world, there’s no such thing as a perfectly fair coin, die, or computer-generated random number. Ok, I see you growling at your computer screen. Yes, that’s a very obvious point to make. Yes, yes, we all know that our models aren’t perfect, but they are very close approximations and that’s good enough, right? Perhaps, but good enough is still wrong, and assuming that your theory will always match up with reality in a “good enough” way puts you on the express train to ruin, despair and sleepless nights.

Let’s make this a little more concrete. Suppose you have just tossed a coin 10 times, and 6 out of the ten times it came up heads. What is the probability you will get heads on the very next toss? If you had to guess, using just this information, you might guess 1/2, despite the empirical evidence that heads is more likely to come up.

Now suppose you flipped that same coin 10,000 times and it came up heads exactly 6,000 times. All of a sudden you have a lot more information, and that information tells you a much different story than the one about the coin being perfectly fair. Unless you are completely certain of your prior belief that the coin is perfectly fair, this new evidence should be strong enough to convince you that the coin is biased towards heads.

Of course, that doesn’t mean that the coin itself has memory! It’s simply that the more often you flip it, the more information you get. Let me rephrase that, every coin toss or dice roll tells you more about what’s likely to come up on the next toss. Even if the tosses converge to one-half heads and one-half tails, you now know with a high degree of certainty what before you had only assumed: the coin is fair.

The more you flip, the more you know! Go back up and reread Bernstein’s quote. If that’s the first thing you learned about probability theory, then instead of knowledge you we’re given a very nasty set of blinders. Astronomers spent century after long century trying to figure out how to fit their data with the incontrovertible fact that the earth was the center of the universe and all orbits were perfectly circular. If you have a prior belief that’s one-hundred-percent certain, be it about fair coins or the orbits of the planets, then no new data will change your opinion. Theory has blinded you to information. You’ve left the edifice of science and are now floating in the either of faith.


23
Nov 11

Monty Hall revisited

Chances are you’ve already heard about the Monty Hall problem. I wouldn’t be mentioning it at all, except that I keep reading descriptions of the problem that miss the absolutely critical point. For those who are new to the problem, here’s a summary:

Suppose you’re a contestant on a game show. The host, Monty Hall, shows you three numbered doors. Two of these doors hide goats, which you don’t want, and one of them hides a shiny new convertible, which you do. Pick the right door and you go home with the convertible, pick the wrong door and you get the goat (which I suspect they don’t even really give you). You make your best guess and choose a door. But before showing what’s behind it, Mr. Hall opens one of the other two doors to reveal a goat. “Now”, he asks, “do you want to stick with your original choice, or do you want to switch doors to the other one that hasn’t been opened yet?”

While you try desperately to remember the rules for conditional probability, the studio audience yells out suggestions and an attractive model smiles at you, making you wonder if you should ask if she comes with the car, but then you realize she probably gets that question all the time. Time is running out! Should you switch doors?

The correct decision, at least in terms of maximizing your chances of winning the car (but, alas, not the model), is to switch. IQ Test Grand Champion and writer Marilyn Vos Savant famously answered the question in one of her columns. Her answer, that you should switch, was widely controversial. The math behind the solution is surprisingly simple, though it rarely seems be presented in a simple way. Your first guess has a one-in-three chance of being right. That means your first guess has a two-in-three chance of being wrong. If your first guess was wrong, that means the car must be behind one of the other two doors. Since Monty just showed you the goat, the car must be behind the other door. Switch and you will get the car for sure. If you don’t switch, your chance of winning remains one-in-three. If you do switch, it jumps up to two-in-three. So ignore the studio audience and don’t get distracted by the model. Just call out the number of that other door!

But wait! Did you catch the missing assumptions needed to make this solution work? The big one, for me, is that Monty Hall will always follow the same procedure of opening up a door with a goat, regardless of what’s behind the door you picked. If you distrust Monty, you might suspect that he will only show you a goat when you’ve picked the car, in order to entice you to switch and loose the car. In that case you should stick with the door you have. Or perhaps Monty shows the goat more frequently when the car is picked first (but not all the time), in which case switching may or may not be the best strategy.

The part where I yell
The problem here is that the Monty Hall problem MAKES NO SENSE WITHOUT AN EXPLICIT PRIOR on Monty Hall’s behavior. Sorry for the yelling, but the point is too important to miss. In this case, the prior is your belief about the procedure Monty is using, and how strongly you hold that belief to be true. The notion of a “prior” might be difficult to explain to a general audience, but assuming a particular one without stating it directly is poisonous. The Monty Hall problem, like many others, can’t be turned into math without first assuming some kind of probability distribution for the inputs.

Usually, when one the distributions of an input isn’t specified, we tend to assume that every possible option has an equal chance of occurring; in other words that we have a uniform probability distribution. This makes sense for another hidden assumption in the problem — that either the game show contestant has made his first pick randomly, or that the prizes were placed behind doors randomly. Though even here I tend to agree with mathematical historian Byron Wall, who argues that our default assumption of a set of equally likely events is problematic. But in the case of the Monty Hall problem, there’s no uniform to even assume. The set of possible ways that Mr. Hall could decide to act is infinite and unknowable.

How does Hall pick between the goats?
Another hidden assumption is that Monty randomizes which door to reveal if the unpicked doors are both hiding goats. If he didn’t, and you knew for sure that Monty would always pick the door with the lower number if when he had a choice, then the math works out differently. Now, if you pick door number 1 and Monty shows you a goat behind door number 3, you know for sure car must be behind door number 2. Switching guarantees you a win! If you pick door number 1 and Monty opens door number 2, that could mean either a car or a goat is behind door number 3. To calculate your odds of winning by switching, you can use Bayes’ theorem to find the probability that a car is behind door number 3, given that Monty reveled a goat behind door 2.

Work out the math, and you should get one-half. In other words, if Monty shows you door number 2, and if he’s using the rule stated above, then switching doors gives you a one-half probability of winning, as does staying with the door you have. It doesn’t matter. No matter which door Monty reveals, switching your pick is never worse than not switching, and sometimes it’s better to switch. That means it’s what game theorists call a dominant strategy, one you would always want to employ. Even so, since Monty’s door revealing rules can change your odds of winning, this is another hidden assumption that should have been made explicit.

Back when goats were golden
When the Monty Hall problem was originally described to me, I assumed that Monty had chosen a door to reveal at random, and that this door just happened to contain a goat. Perhaps not the most reasonable assumption to make, but at the time I was still young enough to think that winning a goat might be cooler than winning some K-car convertible (hum… maybe I still believe that). At any rate, I didn’t have the skills to work out a solution under my assumptions back then, but doing it now takes just a little bit of work.

The probability that you will win after switching, given that Monty “accidentally” reveals a goat, is actually the sum of two other probabilities. The first probability, that you will win by switching if both of the other doors contain goats, is zero. The second is the probability that only one of the two others doors was hiding a goat, in which case you will win for sure, since we already assumed that Monty revealed a goat. Because we know that Monty picked a goat by accident, we gain no additional information about the door we picked or the alternative we might switch to. Each one is equally likely to have the car, so switch or not, our probability of winning is one-half.

If you find this explanation confusing, you might want to try Jeffrey Rosenthal’s explanation, which shows how to re-normalize probabilities of events within your target condition.

The Man Who Loved Only Bayes
After publishing her solution, Vos Savant was flooded with letters telling her she got it wrong. I suspect that many of those readers were ignorant of her assumptions, though Vos Savant says that most people fully understood the problem, and simply didn’t accept her solution. One of the few accounts to mention the importance of Monty Hall’s procedural rules, even though that part only comes after 8 pages of discussion, is in Paul Hoffman’s “The Man Who Loved Only Numbers”. To explain why so many people, many of them with advanced degrees, got it wrong, Hoffman quotes mathematician Andrew Vázsonyi:

“Physical scientists tend to believe in the idea that probability is attached to things. Take a coin. You know the probability of a head is one-half. Physical scientists seem to have the idea that the probability of one-half is fused with the coin. It’s a property. It’s a physical thing. But say I take that coin and toss it a hundred times and each time it comes up tails. You will say something is wrong. The coin is false. But the coin hasn’t changed. It’s the same coin that it was when I started to toss it. So why did I change my mind? Because my mind has been upgraded with information. This is the Bayesian view of probability. It took me much effort to understand that probability is a state of mind.”

I might view probability more in terms of degrees of (rational) belief, but the Vázsonyi quote highlights a key component missing in much of science: the direct recognition that you have a prior, and that this prior is a form of bias, very often baked right into the model you have chosen. There is no escape from this bias! The frequentest approach to probability is really just a special case within the world of Bayesian inference, where you have picked an uninformative (or minimally informative?) prior. But even here you have to model the prior. You have to know: how are we assuming that Monty Hall makes his decision about showing the contestant a goat? Is it based on some fixed probability regardless of which door the contestant picks? Does Monty consult the entrails of a chicken? As mentioned before, the world of possibilities is infinite, and no progress can be made in terms of our understanding until we delineate a space in which our prior beliefs will live. Only once we’ve done that, implicitly or (preferably!) explicitly, can we test out our beliefs, and update them based Monty Hall’s actions.