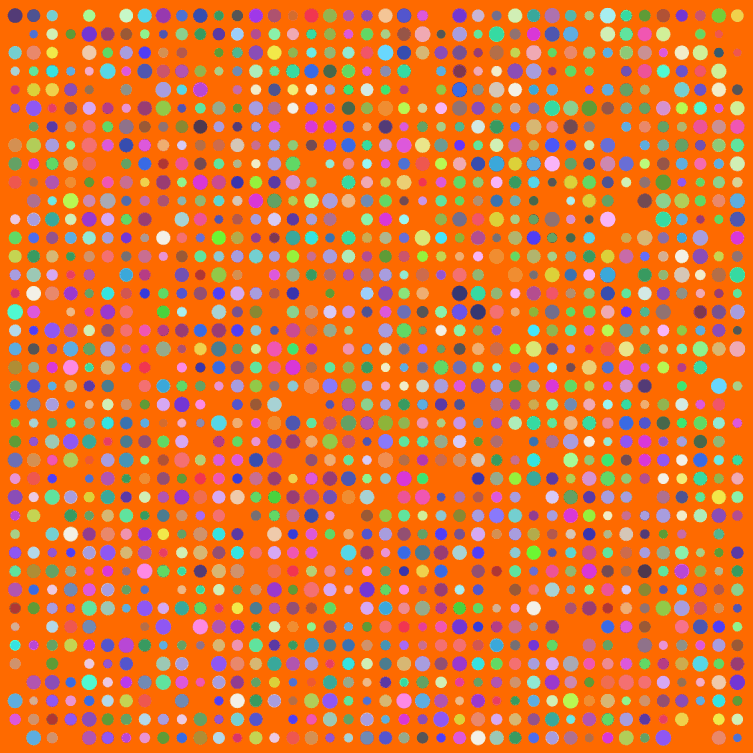
I have a few posts nearing completion, but meanwhile a weekend break for art. Big thanks to Simon Urbanek and Jeffrey Horner, creators of Cairo, a library for the programming language R. Have you noticed how R can’t anti-alias (fancy way for saying smooth out lines and curves when creating a bit-mapped image)? Cairo can.
Make sure to click the image above for the full version. Here’s my code:
# The Cairo library produces nice, smooth graphics
Cairo(1200, 1200, file="D:/Your/Path/Here/Dots.png", type="png", bg="#FF6A00")

# How big should the grid for placing dots be?
myWidth=40
myHeight=40

dotsPlaced = myWidth*myHeight

# Optional default colors and sizes for dots
myColors = rep(c("#0000F0","#00F000"),dotsPlaced)
myCex = rep(3.2,dotsPlaced)

for(i in 1:dotsPlaced) {
	# Change this to allow more of the default color dots to survive
	if(runif(1)<1) {
		myColors[i] = paste("#",paste(sample(c(3:9,"A","B","C","D","E","F"),6,replace=T),collapse=""),collapse="",sep="")
	}
	myCex[i] = runif(1,3,6)
}

# Keeping this is marginal
par(oma=c(0,0,0,0))
par(mar=c(0,0,0,0))

# Start off with a blank plot. The white dot helps with cropping later
plot(0,0,pch=".",xlim=c(0,40),ylim=c(0,40),col="white", xaxt = "n", yaxt = "n")

for(m in 1:myWidth) {
	for(n in 1:myHeight) {
		if(runif(1) < .93) {
			points(n,m,pch=20,col=myColors[((m*n)+n)],cex=myCex[((m*n)+n)])
		}
	}
}

dev.off() # Tell Cairo to burn the plot to disk

