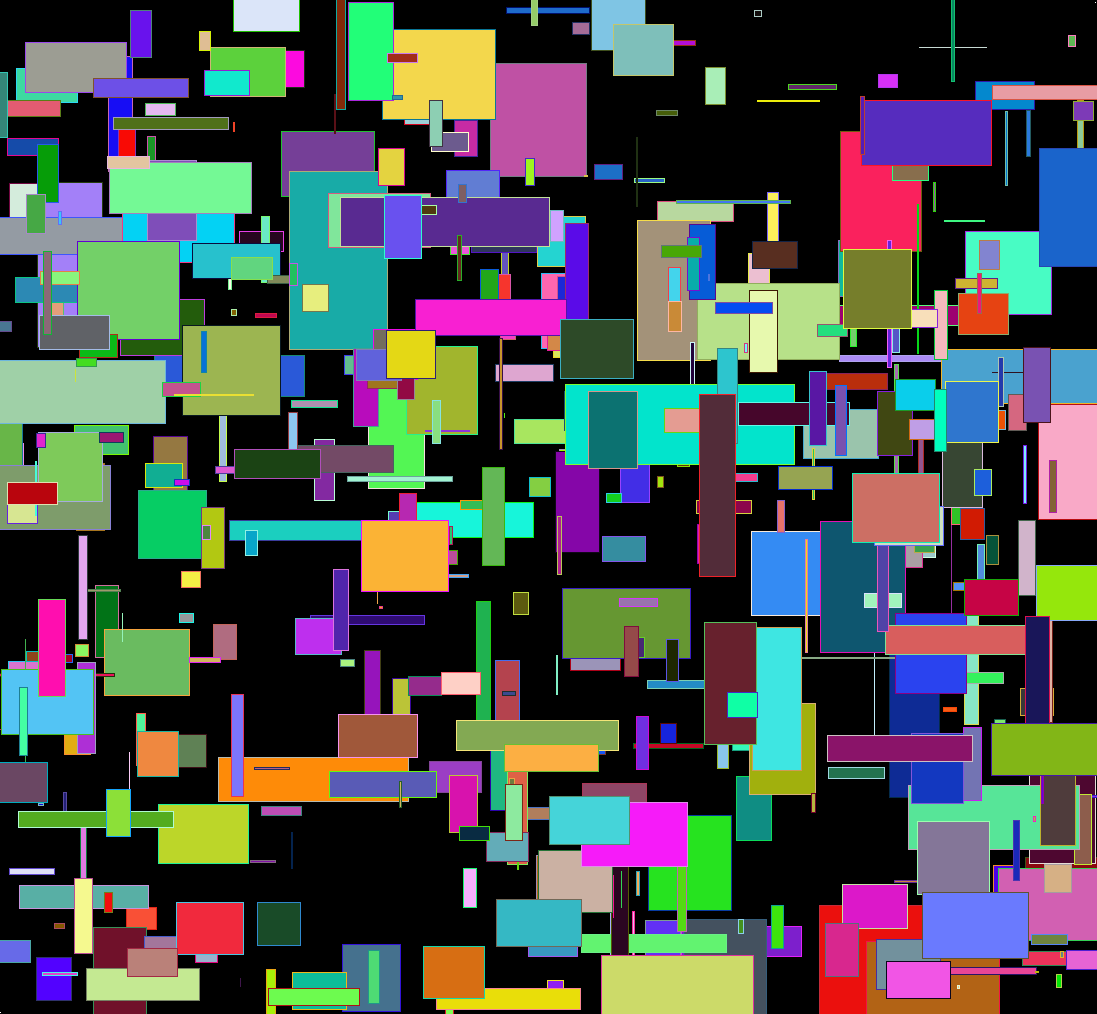
As usual click on the image for a full-size version. Code:
par(bg="black")
par(mar=c(0,0,0,0))
plot(c(0,1),c(0,1),col="white",pch=".",xlim=c(0,1),ylim=c(0,1))
iters = 500
for(i in 1:iters) {
	center = runif(2)
	size = rbeta(2,1,50)

	# Let's create random HTML-style colors
	color = sample(c(0:9,"A","B","C","D","E","F"),12,replace=T)
	fill = paste("#", paste(color[1:6],collapse=""),sep="")
	brdr = paste("#", paste(color[7:12],collapse=""),sep="")

	rect(center[1]-size[1], center[2]-size[2], center[1]+size[1], center[2]+size[2], col=fill, border=brdr, density=NA, lwd=1.5)
}
