- Professor Ramon van Handel of Princeton University posts his lecture notes on Probability in High Dimension.
- Everday Anayltics shares his experience as a statistical consultant on a project for Delta Airline data using PCA and K-means Clustering.
- If you know R and want to improve your SAS skills (or the other way around), check out this tutorial on logistic regressions using both packages.
- Do you trade stocks? If so, here is A Simple Shiny App for Monitoring Trading Strategies.
- Maybe I Don’t Really Know R After All.
- And finally, why we should Separate Statistical Models of “What Is Learned” from “How It Is Learned”.
June, 2014
29
Jun 14
The week in stats (June 30th edition)
22
Jun 14
The week in stats (June 2nd edition)
- A sequence of 9 courses on Data Science will start on Coursera on 2 June and 7 July 2014, to be lectured by Professors of Johns Hopkins University. The courses are designed for students to learn to become Data Scientists and apply their skills in a capstone project. The courses are free, but if you want a Verified Certificate in the course, the Specialization Certificate or taking the Capstone Project, there is a small charge for that.
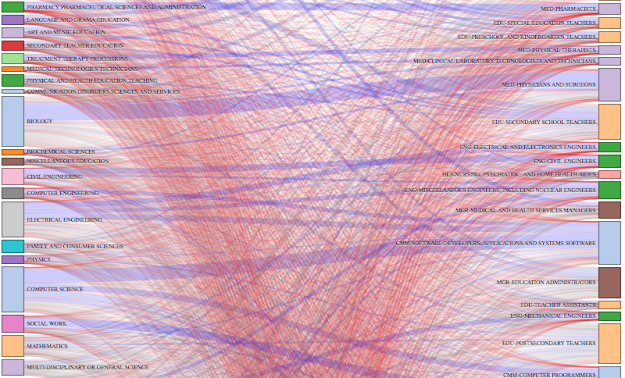
- Do you know where people are going after college? Ben Schmidt, an assistant professor of history at Northeastern University, was curious about careers after college degrees, so he used a quick Sankey diagram to look at data from the American Community Survey.
- Robert Seaton shares more than 100 interesting data sets for statistics. If you are looking for some numbers to get your hands dirty, this is the place to visit.
- Cartesian Faith publishes the second chapter of his book (available for free on his website) called Modeling data with functional programming in R.
- Nina Zumel from Win-Vector LLC discusses some useful tricks with the R function glm() in her recent blog post titled Trimming the Fat from glm() Models in R.
- And finally, if you learned R in its early days (early 2000s or before), you may still be using some old-fashioned ways to accomplish some tasks better served by newer functions and packages. To help you become a better R coder, Revolution Analytics offers hipsteR: Learn what you missed in R as an early adopter.
22
Jun 14
The week in stats (June 23rd edition)
- If you are on the job market, Tal Galili from R bloggers has compiled 3 new R jobs for seekers like you.
- Text mining is currently a live issue in data analysis. Enoromus text data resourses on the Internet made it an important component of Big Data world. If text mining is something that you need to do for your job, you should read Text mining in R – Automatic categorization of Wikipedia articles.
- Randy Olsen, PhD student at Michigan State University’s Computer Science program, studies the percentages of undergraduate degrees conferred to men in the USA and publishes his findings in a blog titled The double-edged sword of gender equality.
- Who will win the World Cup? See what statisticians say.
- Earlier this month, the results of the 15th annual KDnuggets Software Poll were released and R’s popularity continues to grow. See Revolution Analytics’ new post for details.
- And finally, Xi’an discusses a new paper by Simon Barthelmé and Nicolas Chopin called The Poisson transform for unnormalised statistical models.

16
Jun 14
The week in stats (June 16th edition)
- Writing functions is an important part of programming, and in order to write proper functions you need to know how to debug when your functions aren’t working. Slawa Rokicki, PhD student at Harvard, explains How to write and debug an R function.
- It is often said that you should avoid loops in R because R is extremely slow with iterations, and hence many R-programmers try to avoid loops by working with matrices and arrays. Did you know that an even better option is to run your loops in C++ and import your result back into R? Here is a quick tutorial called how you can use C++ within R.
- Rasmus Bååth blogs about the The Most Comprehensive Review of Comic Books Teaching Statistics.
- Did you know that more and more startups are starting to use R as their primary data analysis tool? According to Revolution Analytics, Uber and CultureAmp have just joined the R camp.
- Xi’an reviews a new paper called Generalizations related to hypothesis testing with the Posterior distribution of the Likelihood Ratio by Smith and Ferrari.
- And finally, DiffusePrioR writes “If history can tell us anything about the World Cup, it’s that the host nation has an advantage of all other teams”. Do you agree or disagree, and what do you think is Brazil’s chance of winning the World Cup?
http://bit.ly/SHnlXH
15
Jun 14
The week in stats (June 9th edition)
- Like the plots above? Learn how to create these in R from Freakonometrics’ new post called Box plot, Fisher’s style.
- If you are on the job market, Tal Galili from R bloggers has compiled 6 new R jobs for seekers like you.
- Big Data has gained lots of popularity recently, and every data scientist should know at least something about it. If you are new to data science, consider this introduction to R for Big Data with PivotalR.
- Using Repeated Measures to Remove Artifacts from Longitudinal Data by Dmitry Grapov.
- And finally, Andrew Gelman discusses Why we hate stepwise regression.
12
Jun 14
A new way to visualize content
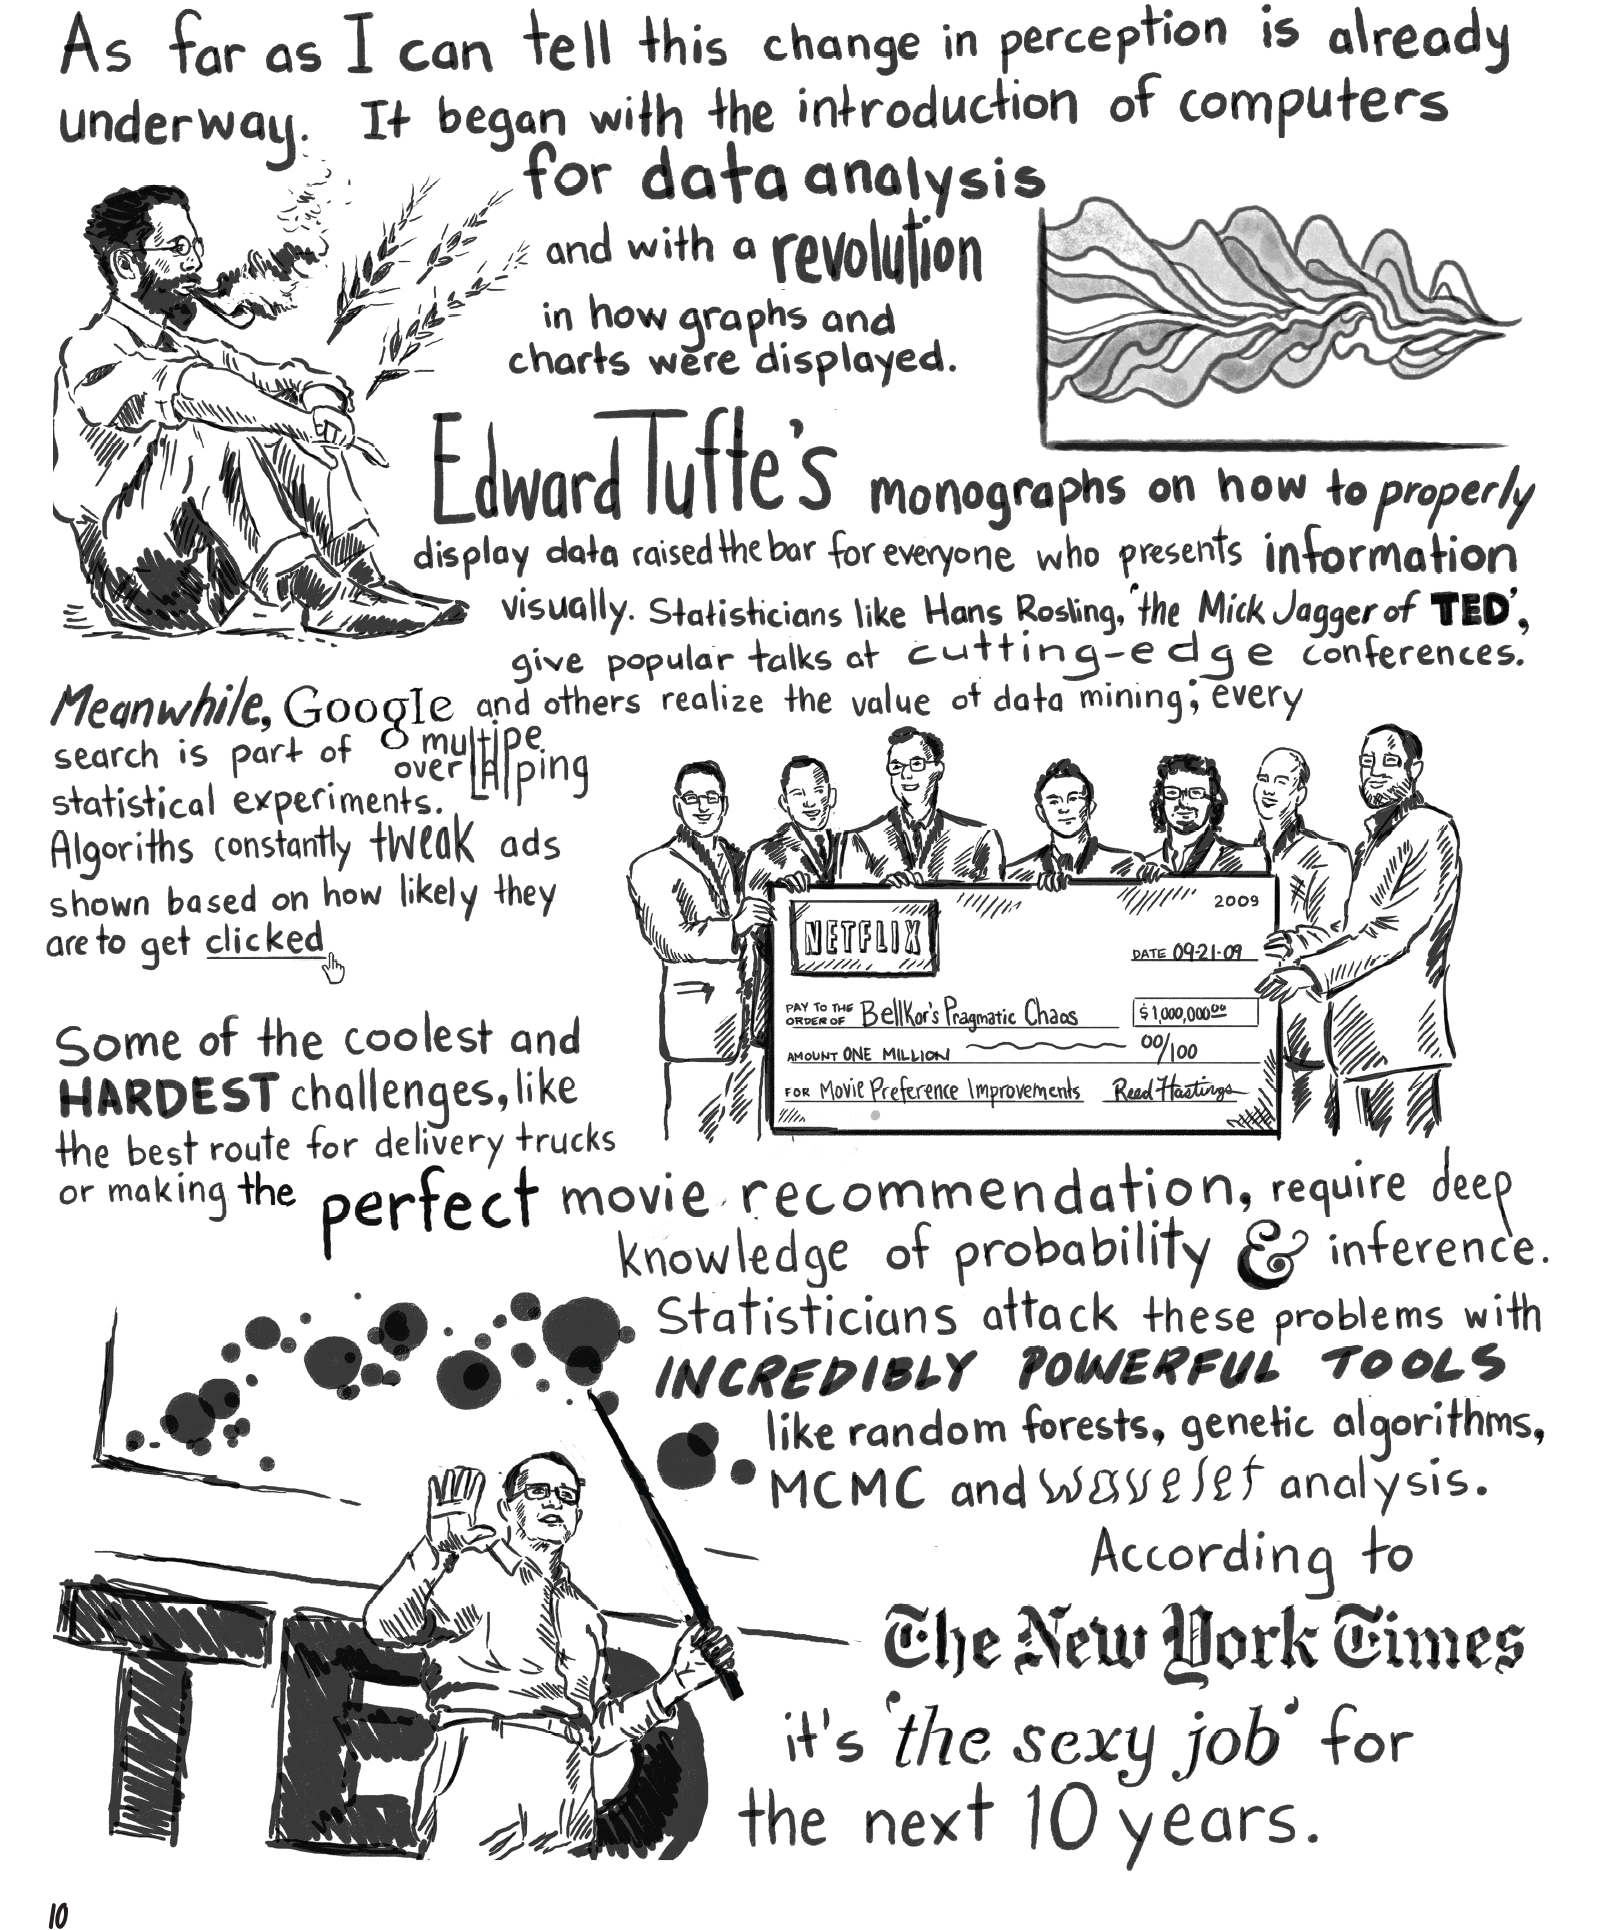
Right now I’m working on a project that involves new ways to view units of content and the relationships between them. I’ve posted the comic I worked on, it has a number of stats references throughout. This is early alpha stages for the software, you may run into issues. To see the relationships, go to the puffball menu and make sure that “Show relationships” is clicked.


