- Wiekvoet presents a simple R trick that allows you to plot y and log(y) in one figure – this is very useful for analyses where you need to compare growth rates of functions.
- Simple Statistics publishes A summary of the evidence that most published research is false and discusses why they believe there is very little evidence to substantiate that most published research is false.
- A new application of probability – Learning mathematics via Monte Carlo Methods.
- Naming Rules in R – dos and don’ts that will make your R code more elegant.
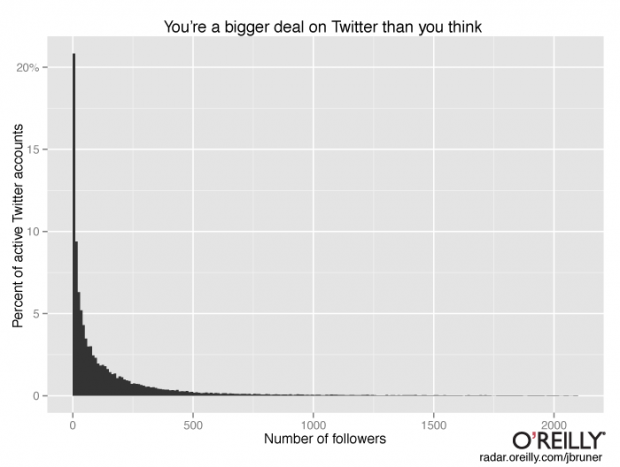
- Revolution Analytics conducts a study with a random sample of 400,000 active Twitter handles, and displays the distribution of the number of Twitter followers. Do you want to know where you rank by the number of followers?
- And finally, the R User Conference, useR! 2014 is scheduled for July 1-3, 2014 at the University of California, Los Angeles. If you would like to submit a proposal for a three hour tutorial on a special topic regarding R, please contact the organizing committee before January 5, 2014.
December, 2013
23
Dec 13
The week in stats (Dec. 23rd edition)
16
Dec 13
The week in stats (Dec. 16th edition)
- For those who love the TV show CSI: Crime Scene Investigation, a tutorial on how you can detect traces of data fraud using R.
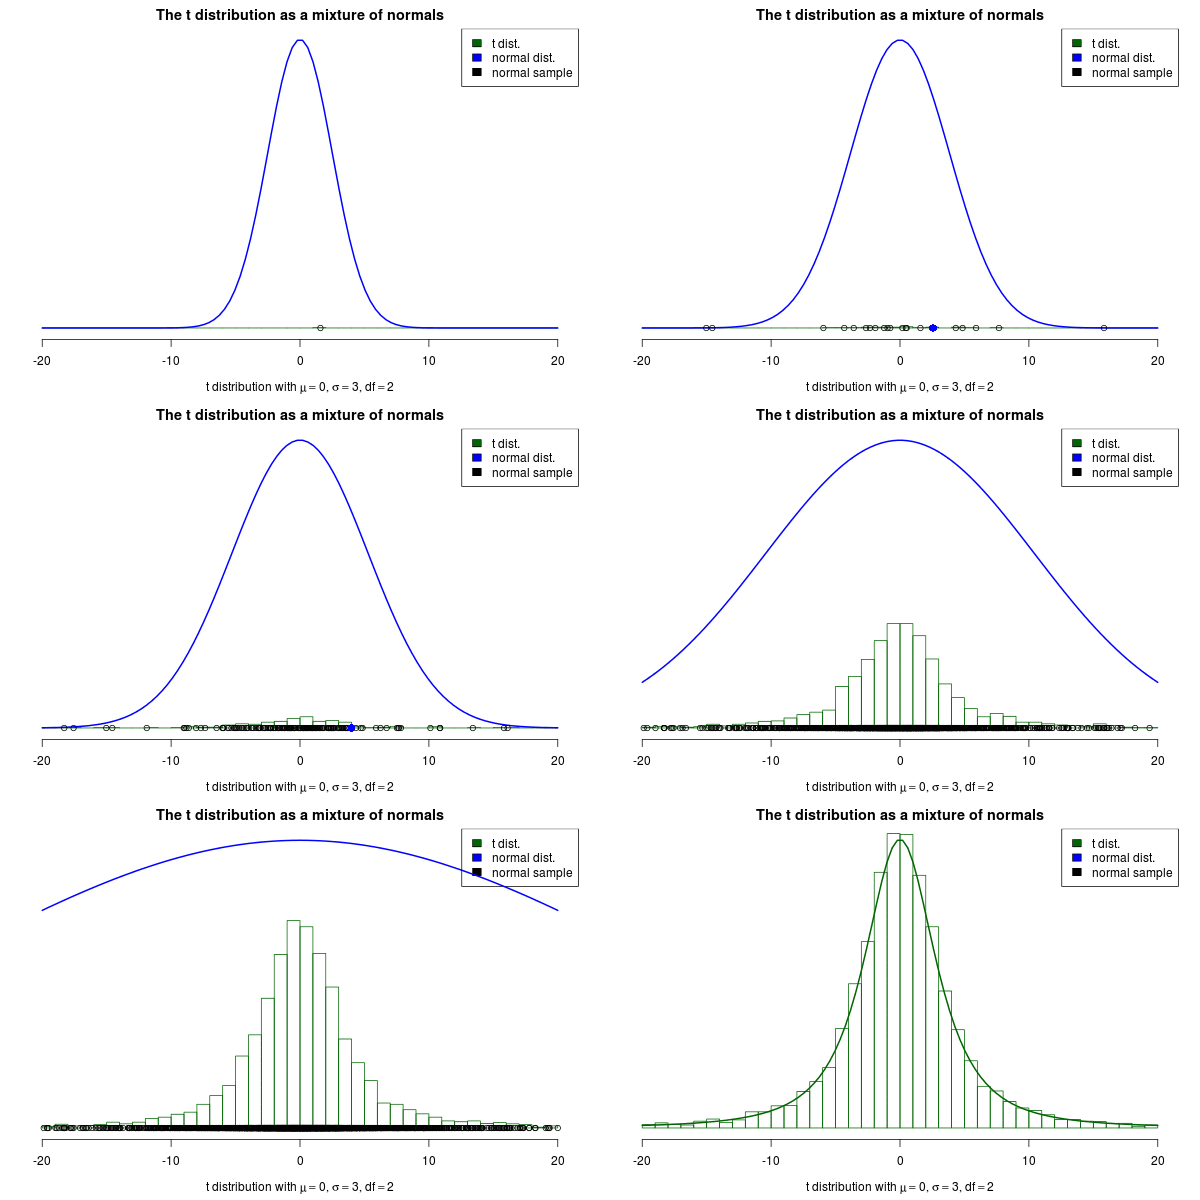
- Did you know that a t-distribution can be written as a mixture of Gaussians? Here how it works.
- PirateGrunt continues his series “24 Days of R”.
- etcML is an online text classification startup (advised by Andrew Ng of Stanford University) that helps answer questions like, Is your favorite sports team is popular on Twitter? Or, Is your kickstarter proposal is written for success?
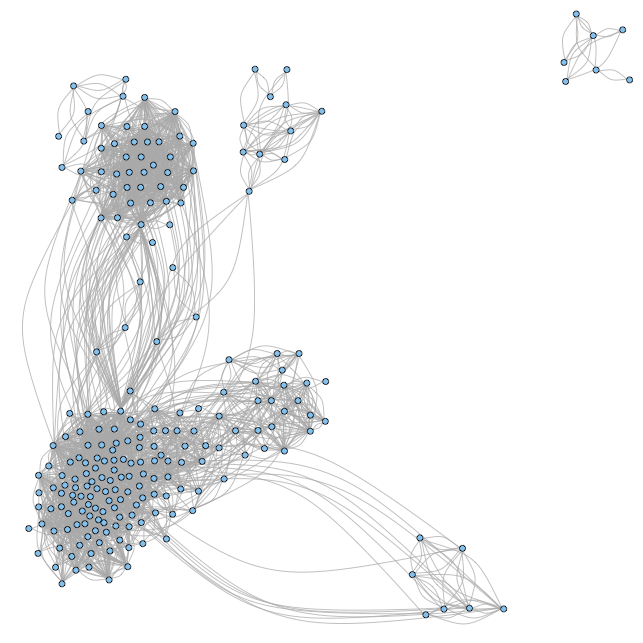
- A tutorial on how to use matrix factorization to analyse social network graphs.
- Revolution Analytics conducts an analysis on R packages and found over 30 R packages require 10 or more prerequisite packages (with SISUS requiring 19), while most packages have 3 or less dependencies.
- And finally, if you flip a fair coin 100 times, what is the probability that you will get 60 or more heads?
10
Dec 13
Prize for statistics students?
In order to promote work on statistical simulations, as well as thinking about deeper issues in data analysis, I’m considering starting a prize for students.
Here are my ideas:
* One prize would be for the most innovative use of Monte Carlo methods to model a problem in pure or applied statistics. This prize would be offered in two divisions: undergraduate and graduate.
* One prize would be for an essay that explores the foundations of probability theory or statistics with an emphasis on epistemological issues. This would be open to all students.
* Prizes would be in the $3,000 – $6,000 range.
* The judging committee would be drawn from professors, students and industry.
What are your thoughts? Specifically:
* If you’re a student, is this something you’d apply for?
* If you’re a professor or instructor, do you think your students would be interested in this? Would you pass along the information to them?
* If you represent a company, could you see advantages to sponsoring one of the prizes?
* What changes or suggestions do you have?
9
Dec 13
The week in stats (Dec. 9th edition)
- The problems with using a p-value as a fixed cutoff for hypothesis testing are well known. Probabilities and P-Values is another article that discusses the weakness of the p-value. However, like every author who claims the p-value is horrible, no one is able to produce a satisfactory substitute.
- PirateGrunt is currently producing a series of 24 articles called 24 Days of R. In every post, he shares a few neat R tricks and explains how you can use them. You may find his first post here and the subsequent ones in his blog.
- Coursera – an online education startup – has rapidly expanded its curriculum of statistics and data analysis courses. There are now 33 modules directly linked to the field, excluding the courses where statistics and data science are used as a supportive tool (e.g. finance). These courses make use of multiple statistical software packages like Python, MATLAB and of course R. Here’s the complete list of Coursera courses using R, ranked by “popularity”.
- For those interested in machine learning, a preview of Data Mining Applications with R by Yanchang Zhao and Yonghua Cen is available here.
- A tutorial on the R package Plotly, and how to make beautiful visuals and graphs with it.
- A recent article by Matt Asay claims that “Python is displacing R as the language for data science.” David Smith of Revolution Analytics discusses his thoughts on the competition of R and Python.
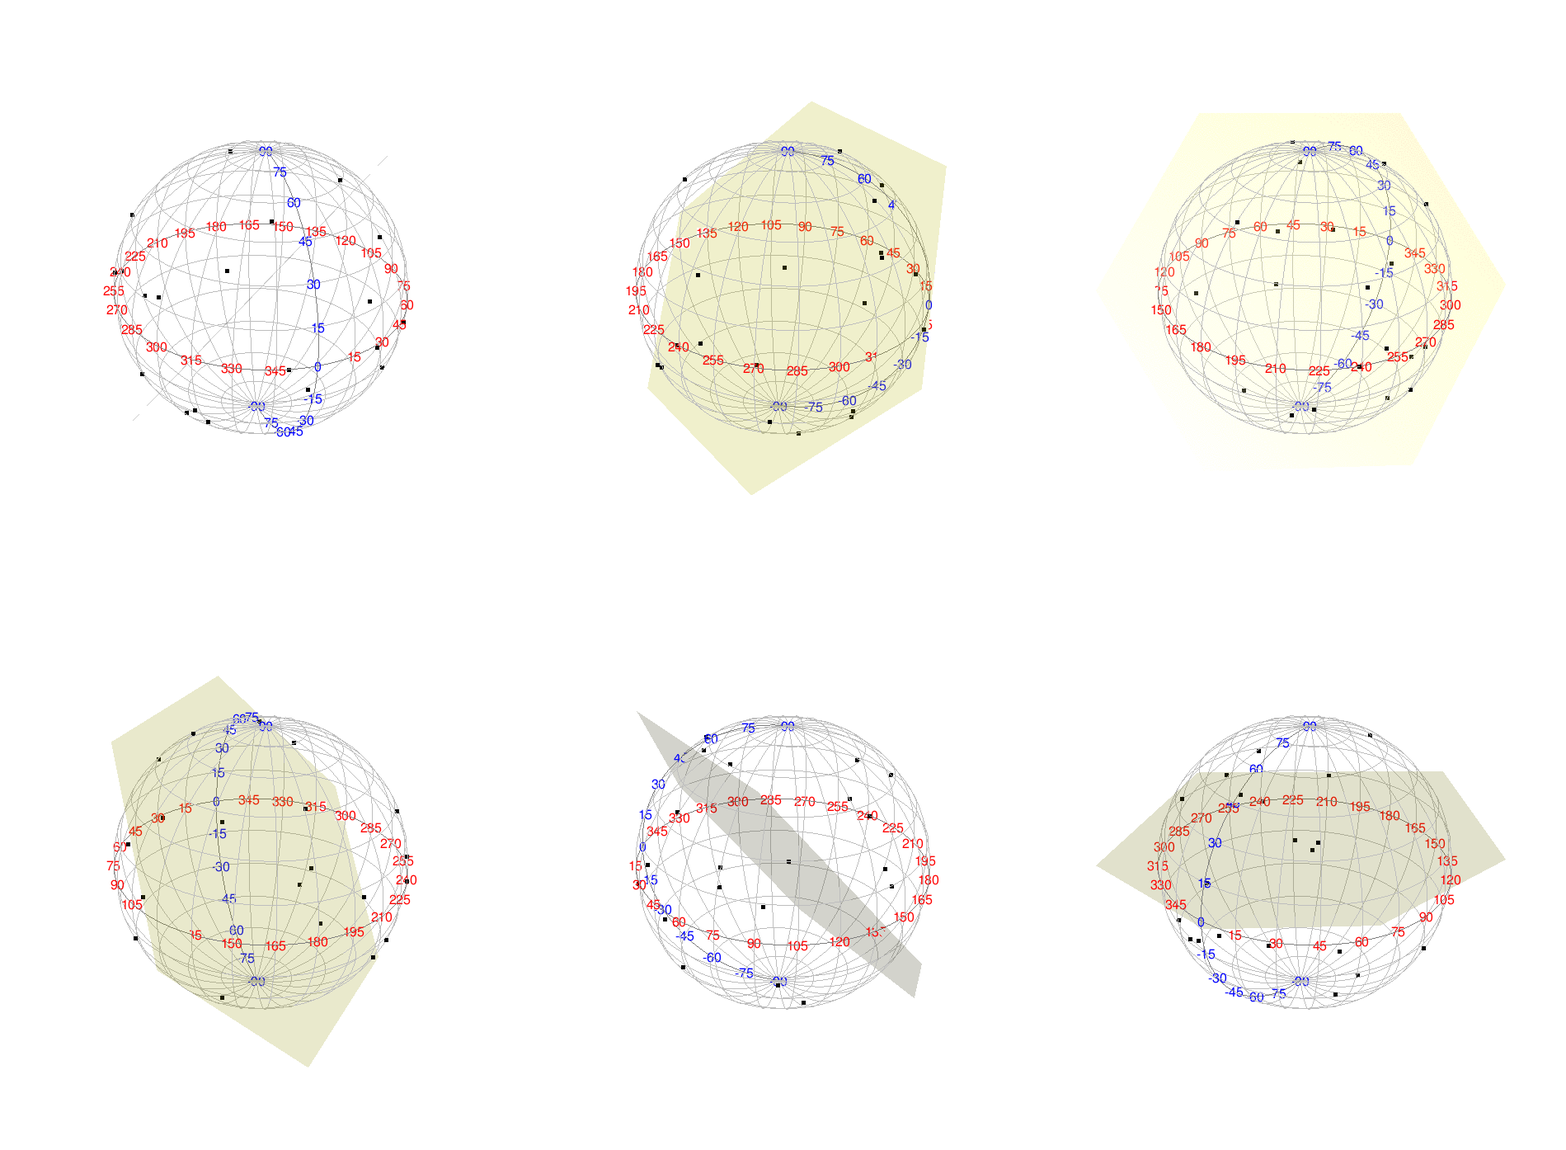
- Consider n points uniformly distributed on a sphere. What is the probability that all points lie on a same hemisphere (not necessarily the north or south hemisphere)? Arthur Charpentier of Freakonometrics presents a simulation-based solution, along with some very nice visuals.
2
Dec 13
The week in stats (Dec. 2nd edition)
- Mixed effect models are useful tools in statistics because they can capture both fixed effects and random effects. Jared Knowles, a PhD student at University of Wisconsin Madison, created a tutorial with real world examples that explains how to run mixed models in R.
- Revolution Analytics compiles a list of industry news on R and statistics, including coverage on Domino, a San Francisco startup on collaborative Data Science, an R visualization tutorial, and some news on Quandl.
- Andrew Gelman discusses the concept of randomization and how it is misused in an interesting blogpost titled Three unblinded mice.
- For the finance and forecasting folks, a simple tutorial on how to create dygraphs using rCharts (don’t know what dygraphs is? It’s a fast, flexible, open source JavaScript charting library).
- How to analyze your Facebook friends network with R? A new package called Rfacebook can help you.
- And lastly, Derek Jones explains why he believes OLS is dead and software engineers like himself should use other tools.


