- Tableau has become a star in the Business Intelligence/Analytics world for its data visualizations. Yet, you can get even more out of Tableau if you integrate it with R. If you also use SQL, here is a tutorial for you on SQL, R and text analysis.
- Bad breaks, then flatlines. Good holds steady.
- Andrew Gelman offers his thoughts on the term marginally significant, which is commonly used but often misleading.
- A list of finance data sources which can be accessed directly using R. This is a must for quants, financial analysts and traders.
- Professor Vivek H. Patil of Gonzaga University describes some R visualization techniques using base R, ggplot2, and rCharts.
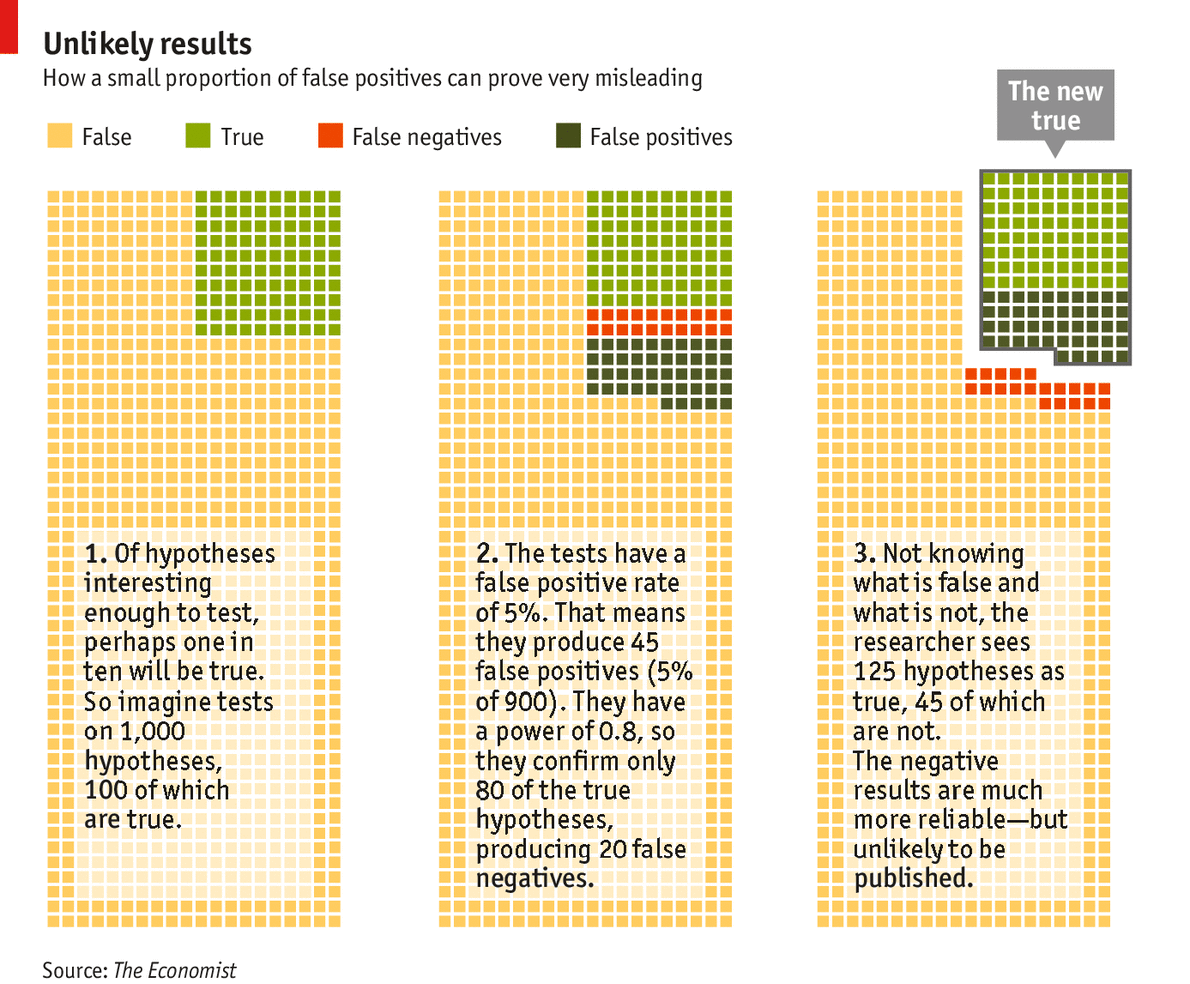
- Christian Robert, of Universite Paris-Dauphine, aka Xi’an, discusses his views on an article from The Economist about statistical significance and why many published research papers are unreproducible.
Posts Tagged: finance
11
Nov 13

