- Mixed effect models are useful tools in statistics because they can capture both fixed effects and random effects. Jared Knowles, a PhD student at University of Wisconsin Madison, created a tutorial with real world examples that explains how to run mixed models in R.
- Revolution Analytics compiles a list of industry news on R and statistics, including coverage on Domino, a San Francisco startup on collaborative Data Science, an R visualization tutorial, and some news on Quandl.
- Andrew Gelman discusses the concept of randomization and how it is misused in an interesting blogpost titled Three unblinded mice.
- For the finance and forecasting folks, a simple tutorial on how to create dygraphs using rCharts (don’t know what dygraphs is? It’s a fast, flexible, open source JavaScript charting library).
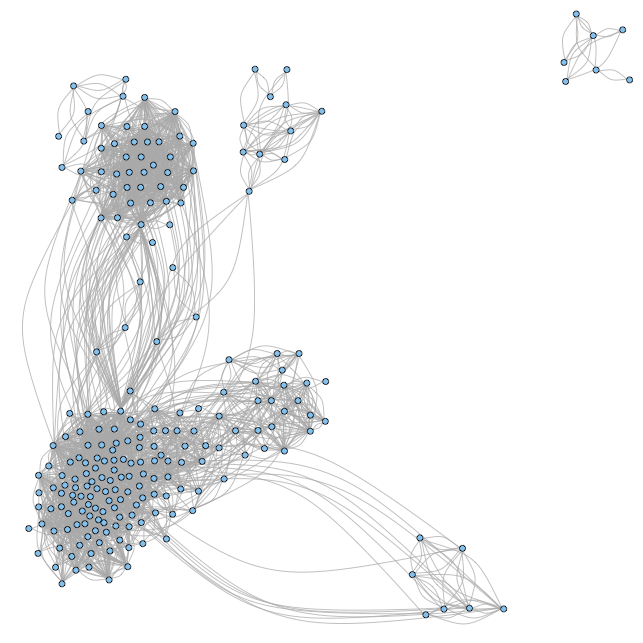
- How to analyze your Facebook friends network with R? A new package called Rfacebook can help you.
- And lastly, Derek Jones explains why he believes OLS is dead and software engineers like himself should use other tools.
Posts Tagged: dygraphs
2
Dec 13

