- Professor Roger Peng of the Johns Hopkins Bloomberg School of Public Health discusses the meaning of Reproducible Analysis, why it is important, and how to ensure that your R analysis is reproducible.
- A recent survey by Revolution Analytics show that R language skills attract median salaries in excess of $110,000 in the United States.
- Last week, many helpful R articles attracted attention from readers. A million ways to connect R and Excel, efficiency of Importing Large CSV Files in R, R framework with Object-Oriented Programming, ggplot Fit Line and Lattice Fit Line in R, and Interactive maps with R.
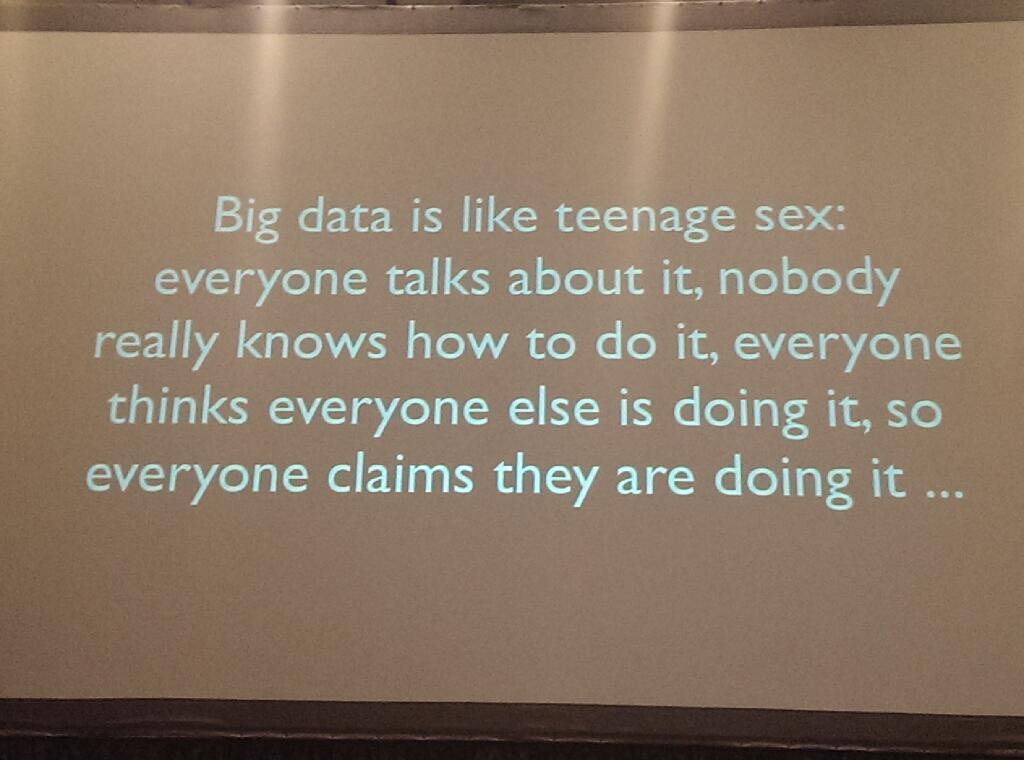
- Big Data is a popular term that everyone in almost every field discusses, however, Stephen Turner, assistant professor of public health sciences and director of the Bioinformatics Core at the University of Virginia, argues that There is no Such Thing as Biomedical “Big Data”.
- Welcome to the age of Databall – the rise of analytics usage in the NBA.
- And finally, suppose that you pick a random interger from 0 to 1000. Given that this integer is divisible by 4, what is the probability that it is also divisible by 3?
17
Feb 14
The week in stats (Feb. 17th edition)
10
Feb 14
The week in stats (Feb. 10th edition)
- The latest survey conducted by RedMonk shows that R is 15th of top programming languages.
- Simplex Regression (a technique that minimizes the absolute error of residuals rather than squared error) is an alternative to traditional least squares because it is resistant to outliers in the data, and helpful in studies where outliers may be safely and effectively ignored. This week, WenSui (文穗) teaches how to fit simplex regressions in R.
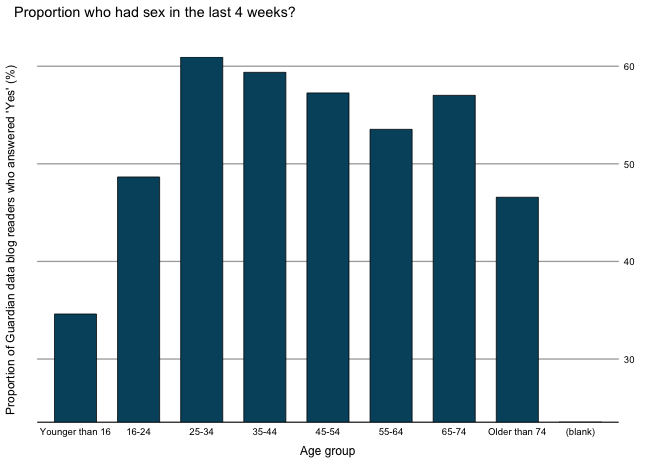
- Does sexual activity change with age?
- Eran Raviv continues the R vs. Matlab comparison. This week, R wins the second round and we are tied at 1-1.
- A brief review of R Studio and “Advanced R Development”
- And finally, Joseph Rickert of Revolution Analytics presents a tutorial on analyzing weather data using his new R package weatherData.
03
Feb 14
The week in stats (Feb. 3rd edition)
- The Odds Ratio is a confusing but unavoidable statistic which comes up in both scientific and non-scientific articles. In a recent short paper published in the British Medical Journal, Robert Grant explains why it confuses people and how it should be interpreted.
- Last week, many helpful R articles attracted attention from readers. Comparisons of R vs. Matlab, and R vs. Python, how to compare multiple (g)lm in one graph, working with time series data sources, Princeton’s guide to linear modeling and logistic regression with R, and A First Look at rxDForest() – an R classification and regression tree package.
- Xi’an discusses a recent paper by Chris Drovandi and Tony Pettitt called Bayesian indirect inference.
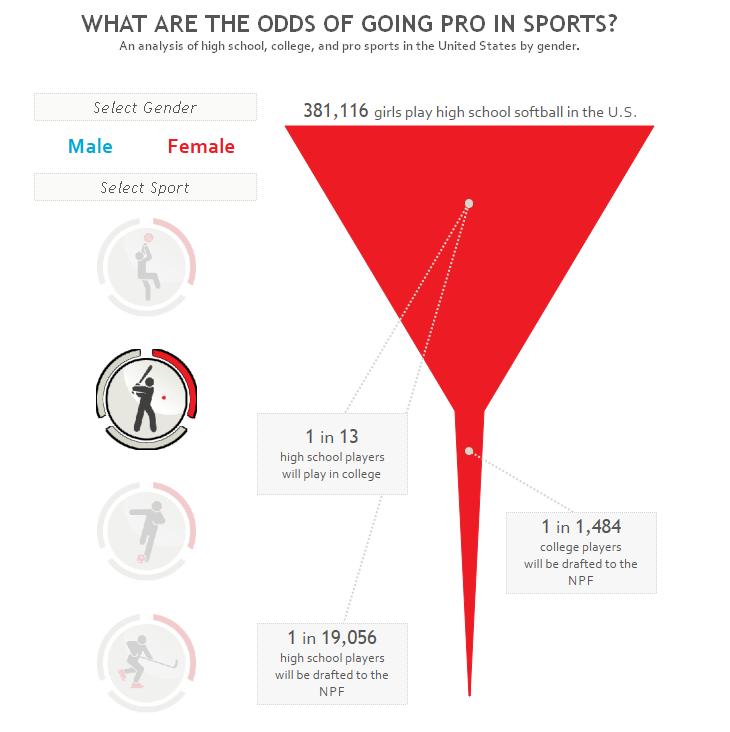
- What are your chances of making it to the big leagues? Ryan Sleeper created an interactive visualization to show the odds for different sports. Choose wisely: for a high school athlete your chances can be as high as one in 170 or as low as 1 in 19,056.
30
Jan 14
Probability Podcast
I’ve produced a pilot episode of a “Probability Podcast”. Please have a listen and let me know if you’d be interested in hearing more episodes. Thanks!
The different approaches of Fermat and Pascal
Pascal’s solution, which may have come first (we don’t have all of the letters between Pascal and Fermat, and the order of the letters we do have is the matter of some debate), is to start at a point where the score is even and the next point wins, then work backwards solving a series of recursive equations. To find the split at any score, you would first note that if, at a score of (x,x), the next point for either player results in a win, then the pot at (x,x) would be split evenly. The pot split for player A at (x-1,x) would be the chance of his winning the next game, times the pot amount due him at (x,x). Once you know the split in the case where player A (or B) lacks a point, you can then solve for the case where a player is down by two and so on.
Fermat took a combinatorial approach. Suppose that the winner is the first person to score N points, and that Player A has a points and Player B has b points when the game is stopped. Fermat first noted that the maximum number of games left to be played was 2N-a-b-1 (supposing both players brought their score up to N-1, and then a final game was played to determine the winner). Then Fermat calculated the number of distinct ways these 2N-a-b-1 might play out, and which ones resulted in a victory for player A or player B. Each of these combinations being equally likely, the pot should be split in proportion to the number of combinations favoring a player, divided by the total number of combinations.
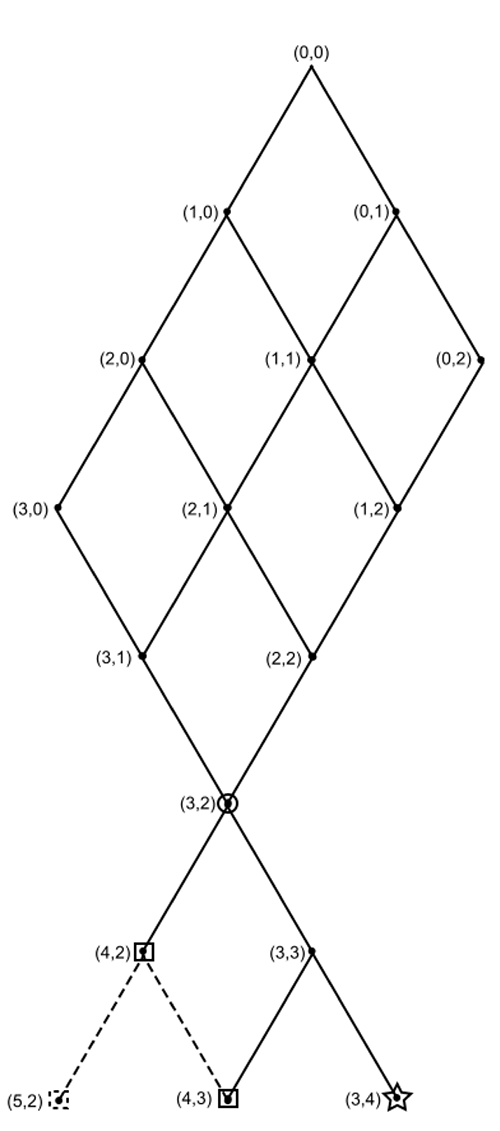
To understand the two approaches to solving the problem of points I have created the diagram shown at right.
Suppose each number in parenthesis represents the score of players A and B, respectively. The current score, 3 to 2, is circled. The first person to score 4 points wins. All of the paths that could have led to the current score are shown above the point (3,2). If player A wins the next point then the game is over. If player B wins, either player can win the game by winning the next point. Squares represent games won by player A, the star means that player B would win. The dashed lines are paths that make up combinations in Fermat’s solution, even though these points would not be played out.
Pascal’s solution for the pot distribution at (3,2) would be to note that if the score were tied (3,3), then we would split the pot evenly. However, since we are at point (3,2), there is only a one-in-two chance that we will reach point (3,3), at which point there is a one-in-two chance that player A will win the game. Therefore the proportion of the pot that goes to player A is 1/2+1/2 (1/2)=3/4 whereas player B is due 1/2 (1/2)=1/4.
Fermat’s approach would be to note that there are a total of 4 paths that lead from point (3,2) to the level where a total of 7 points have been played:
(3,2)→(4,2)→(5,2)
(3,2)→(4,2)→(4,3)
(3,2)→(3,3)→(4,3)
(3,2)→(3,3)→(3,4)
Of these, 3 represent victories for player A and 1 is a victory for player B. Therefore player A should get 3/4 of the pot and player B gets 1/4 of the pot.
As you can see, both Pascal and Fermat’s solutions yield the same split. This is true for any starting point. Fermat’s approach is generally agreed to be superior, as the recursive equations of Pascal can become very complicated. By contrast, Fermat’s combinatorial method can be solved quickly using what we now call Pascal’s Triangle or its related equations. However, both approaches are important for the development of probability theory.
27
Jan 14
The week in stats (Jan. 27th edition)
- If you see a good plot and want the dataset, what should you do? Wiekvoet presents a tutorial on how you can convert graphs into dataset via PlotDigitizer and Engauge Digitizer (and of course R as well).
- When statistics meets rhetoric: A text analysis of “I Have a Dream” in R.
- If you use R and frequently work with business datasets, you may find the following articles useful: Using Scatterplots and Models to Understand the Diamond Market, Estimating a nonlinear time series model in R, Easy data maps with R: the choroplethr package, Database Reflection using dplyr, and Fast and easy data munging, with dplyr.
- PirateGrunt publishes the first article of his new series called An idiot learns Bayesian analysis. As the title suggests, these articles explain key concepts of Bayesian analysis to readers without much background in probability and statistics.
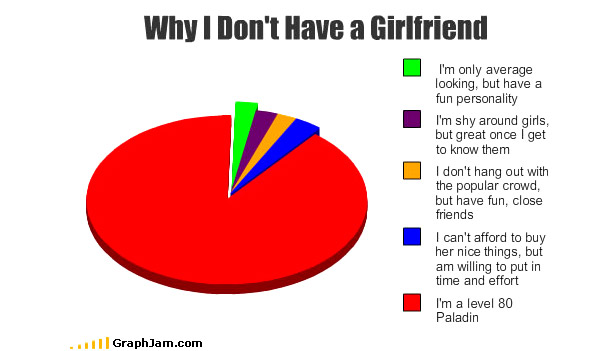
- Wish you had a girlfriend? Learn how to use data to find one.
20
Jan 14
The week in stats (Jan. 20th edition)
- If you do your statistical work in R, but need to present results in slides, read up on how to make your R figures legible in Powerpoint/Keynote presentations.
- We have a collection of good R tips and tricks this week: How to see source code of built-in functions in R, Calling Python from R with rPython, Some good R programming tips, Averaging R Datasets By Group, and An introduction to dplyr (a set of tools for efficiently manipulating datasets).
- Andrew Gelman gives some advice on writing research articles.
- Xi’an discusses a recent paper on accelerated ABC (approximate Bayesian computation), presented during MCMSki 4.
- And finally, show that for any random variables X and Y, and a constant c, we have P(X+Y>c) ≤ P(X>c/2) +P (Y>c/2)
13
Jan 14
The week in stats (Jan. 13th edition)
- This week, we recommend two books on machine learning to our readers: Machine Learning with R by Brett Lantz (reviewed by Alvaro “Blag” Tejada Galindo), and An Introduction to Statistical Learning with Applications in R by Gareth James, Daniela Witten, Trevor Hastie and Robert Tibshirani (a pdf version of this book is available on Gareth James’ website).
- Patrick Burns gives a short tutorial for Excel users who want to start using R called From spreadsheet thinking to R thinking
- Andrew Gelman shares his recent debugging experience.
- Two articles on data visualization: using ggplot2 to help with barplots, and creating whale charts for visualizing customer profitability.
- Arthur Charpentier (aka Freakonometrics) wants to know what are the research interests (in statistics) of different universities. He studies 35 journals in statistics, probability and econometrics, and creates a series of really cool maps and visuals to present his findings.
- And lastly, some interesting results on the amount time people spend on watching porn videos in the UK.
06
Jan 14
The week in stats (Jan. 6th edition)
- Revolution Analytics publishes a number of useful R articles: 15 tips on computing with Big Data for those R users who need to handle large datasets efficiently, Combining the Power of DeployR, rCharts, and AngularJS for data visualization, K-means Clustering 86 Single Malt Scotch Whiskies for clustering analysis, and How to ask for R help when you need it.
- Should there be a Nobel prize in statistics? Xi’an and Gelman discuss their views and thoughts on this.
- Radford Neal of University of Toronto has released a new version of his pqR (pretty quick R). The biggest improvement in this version is that vector operations are sped up using task merging, and the software now has a new logo and its own website.
- Rasmus Bååth, a PhD student at Lund University in Sweden, designs three mascots for of Bayesian Statistics. Have a look at them and let him know which one is your favorite! In another post, Rasmus admits that the confidence interval is a tricky concept for him to grasp when he was a student, and created an animation of the construction of a confidence interval for those who are also not 100% sure where this concept came from.
- Statistics Done Wrong – the woefully complete guide to the most popular statistical errors and slip-ups committed by scientists every day.
- Last, but not least, an introduction to integrating R with Google Map via the R package ggmap.

And finally, Statistics Blog wishes everyone Happy New Year!
23
Dec 13
The week in stats (Dec. 23rd edition)
- Wiekvoet presents a simple R trick that allows you to plot y and log(y) in one figure – this is very useful for analyses where you need to compare growth rates of functions.
- Simple Statistics publishes A summary of the evidence that most published research is false and discusses why they believe there is very little evidence to substantiate that most published research is false.
- A new application of probability – Learning mathematics via Monte Carlo Methods.
- Naming Rules in R – dos and don’ts that will make your R code more elegant.
- Revolution Analytics conducts a study with a random sample of 400,000 active Twitter handles, and displays the distribution of the number of Twitter followers. Do you want to know where you rank by the number of followers?
- And finally, the R User Conference, useR! 2014 is scheduled for July 1-3, 2014 at the University of California, Los Angeles. If you would like to submit a proposal for a three hour tutorial on a special topic regarding R, please contact the organizing committee before January 5, 2014.
16
Dec 13
The week in stats (Dec. 16th edition)
- For those who love the TV show CSI: Crime Scene Investigation, a tutorial on how you can detect traces of data fraud using R.
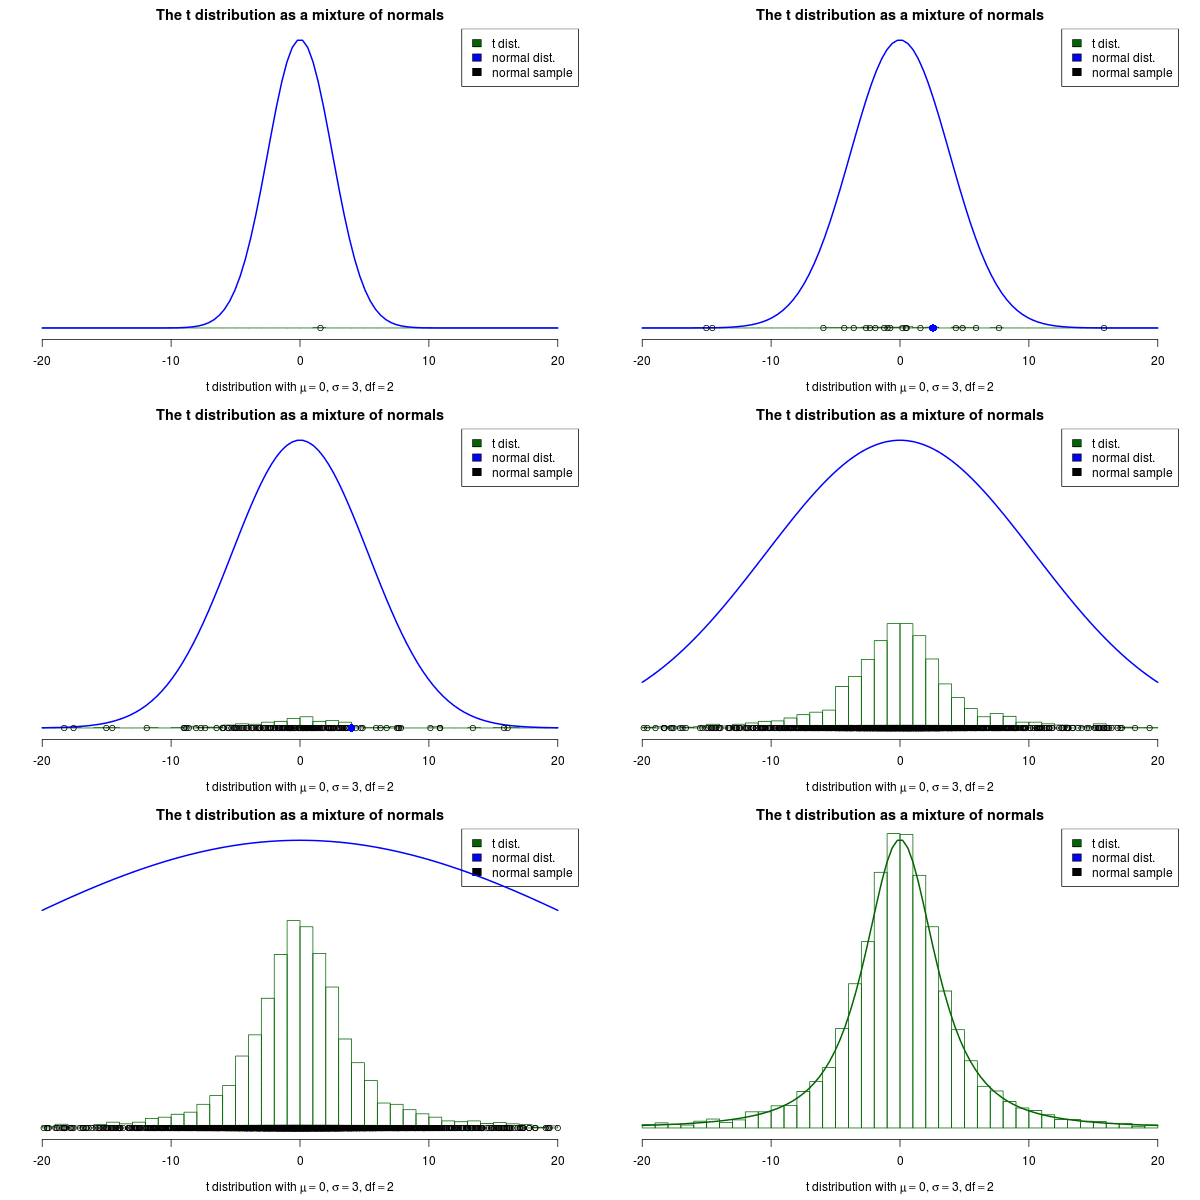
- Did you know that a t-distribution can be written as a mixture of Gaussians? Here how it works.
- PirateGrunt continues his series “24 Days of R”.
- etcML is an online text classification startup (advised by Andrew Ng of Stanford University) that helps answer questions like, Is your favorite sports team is popular on Twitter? Or, Is your kickstarter proposal is written for success?
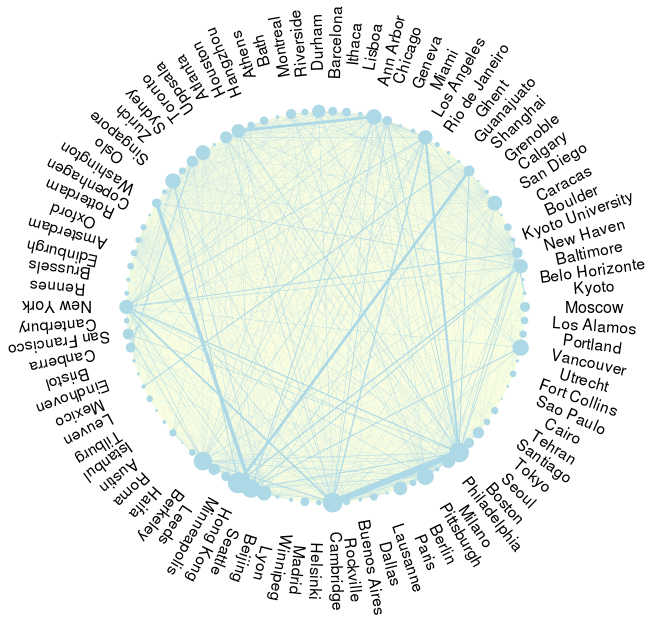
- A tutorial on how to use matrix factorization to analyse social network graphs.
- Revolution Analytics conducts an analysis on R packages and found over 30 R packages require 10 or more prerequisite packages (with SISUS requiring 19), while most packages have 3 or less dependencies.
- And finally, if you flip a fair coin 100 times, what is the probability that you will get 60 or more heads?

