08
Apr 10

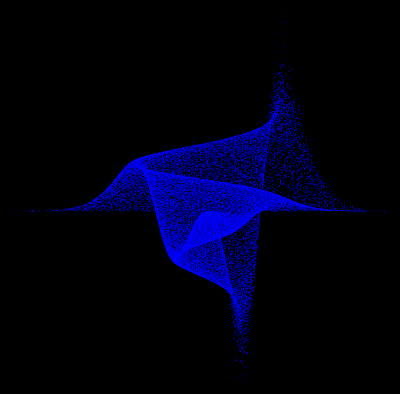
R: another nifty graph

Make sure to click on the image to see the large version. Code for this graph:

moxbuller = function(n) {   
	u = runif(n)   
	v = runif(n)   
	x = cos(2*pi*u)*sqrt(-2*log(v))  
	y = sin(2*pi*v)*sqrt(-2*log(u))
	r = list(x=x, y=y)
	return(r) 
}
r = moxbuller(50000) 
par(bg="black") 
par(mar=c(0,0,0,0)) 
plot(r$x,r$y, pch=".", col="blue", cex=1.2) 

05
Apr 10

R: Clean up your environment

I’ve started using this one quite often. Over time your environment fills up with objects, then when you run a script you don’t know if an error or unexpected result is related to an existing object in your environment.

Use with caution since it will remove all of your working data.

rm(list = ls())

05
Apr 10

Pop-up a choose file dialog box

datafilename <- file.choose()
myData  <- read.table(datafilename,header=TRUE)

25
Mar 10

R plotting fun

Not easy to produce cool looking graphs in R, but it can be done. The results of some messing around are above. Here is the code I used:

x = runif(1000)
y = x/runif(1000)

cexes = 10*y/max(y) # For circle size
par(bg="black") # I see a white background and I want it painted black.
par(mar=c(0,0,0,0)) # Margins? We don't kneed no stinkin' margins.
plot(x,log(y), pch=20, col="white", cex=cexes) 

21
Mar 10

R: Add vertical line to a plot

If you have a plot open and want to add a vertical line to it:

abline(v=20) #Add vertical line at x=20

21
Mar 10

R: Geometric mean

gm(x) 

But this requires package heR.Misc so you might as well just use:

exp(mean(log(x)))

20
Mar 10

R: remove all objects fromt he current workspace


20
Mar 10

R: Backwards for loop

 
for (i in 10:1) {
	print(i)
}

As easy as that.


18
Mar 10

R: Count unique items in a vector

Had to look this one up, so here it is:

length(unique(x))

Counts the number of distinct items in a vector in R.


17
Mar 10

Useful R link

Questions at stackoverflow about R: