- Spreadsheets are user friendly, but they can also be dangerous. Patrick Burns explains why you should avoid spreadsheets and work with R instead.
- How’s your fantasy team doing? Revolution Analytics compiles a series of Fantasy Football modelling articles by Boris Chen of New York Times.
- Rexer Analytics has been conducting regular polls of data miners and analytics professionals on their software choices since 2007. They presented their results at the 2013 Rexer Analytics Data Miner Survey at last month’s Predictive Analytics World conference in Boston.
- Everyone understands the p-value, except for those who don’t. Here is an example that once again shows the p-value – that workhorse of modern science – continues to be misinterpreted in even the top tiers of the scientific literature.
- Despite all the hype surrounding big data and analytics, Louis Columbus of Forbes argues that the majority of business analysts lack access to the data and tools they need. Columbus explains why and how this should be changed.
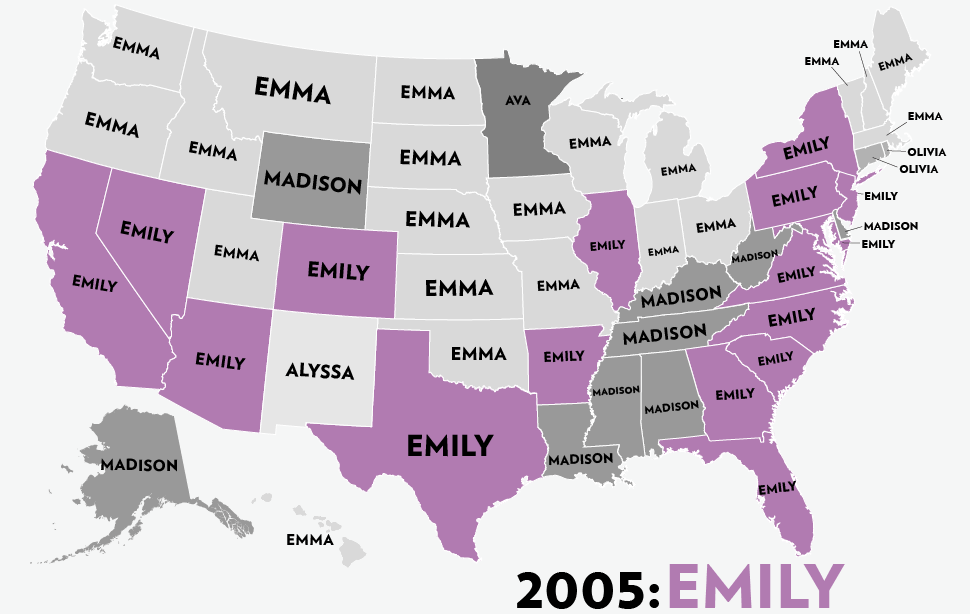
- Six Decades of the Most Popular Names for Girls, State-by-State, represented all in one interactive map.
Uncategorized
21
Oct 13
The week in stats (Oct. 21st edition)
14
Oct 13
The week in stats (Oct. 14th edition)
- The R is my friend blog publishes a series of four articles on neural networks. This is probably one of the most comprehensive introductions to neural networks in R. If you are in love with neural nets and want to learn even more, here is another tutorial by Saptarsi Goswami.
- State-by-state media preferences as revealed by bit.ly.
- Andrew Gelman, Professor of Statistics and Political Sciences at Columbia University, discusses why Bing is preferred to Google by people who aren’t like him.
- Have you heard of Simpson’s Paradox? Here is an interactive visual (using the 1973 Berkeley sex discrimination lawsuit as an example) that explains the paradox in 60 seconds.
- Dan Delany does a visual breakdown of furloughed employees due to the U.S. government shutdown. The main view shows furloughed proportions by department, and there are real time tickers for duration, estimated unpaid salary, and estimated food vouchers unpaid.
- If there is an 82% chance an an event will occur within your life time (and assuming that you live for 70 years), what is the probability that this event will occur on any given day?
- Tableau, the popular interactive data visualization tool, is coming out with a new 8.1 update, and it will include integration with the R language. Learn how to integrate the two in just 30 seconds.
- A short (but not trivial) lesson on data smoothing using R.
9
Sep 13
The week in stats (Sept. 9th edition)
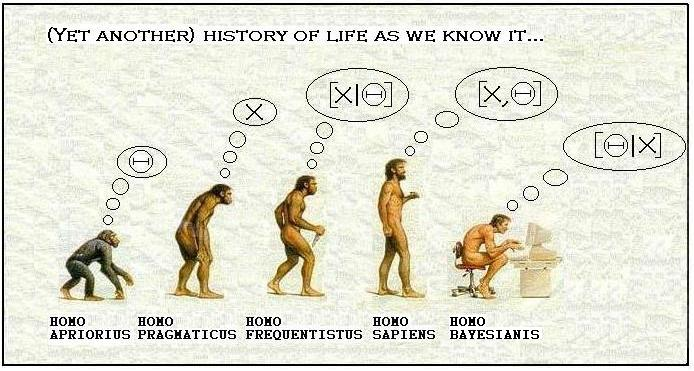
- Larry Wasserman, Professor at Carnegie Mellon University, is a graduate of University of Toronto, a COPSS Award winner, and a leading statistician in Bayesian analysis and inference. In this post, he discusses his views on the question Is Bayesian Inference a Religion?
- Two people will each spend 15 consecutive minutes in a bar between 12:00pm – 1:00pm. Assuming uniform and independent arrival times, what is the probability that they will have a chance to clink glasses?
- Have you ever wondered which statistical package gives the fastest computational speeds? This quick comparison of Julia, Python, R and pqR provides some guidence.
- An interesting analysis of the most popular porn searches in the US.
- A quiz for everyone in the data visualization industry: Identify at least three problems with this chart and explain what you can do to make it better.
- R user groups continue to thrive worldwide. Joseph Rickert from Revolution Analytics prepares the following compilation of the locations of 127 R user groups around the world.
2
Sep 13
The week in stats (Sept. 2nd edition)
- Do you have a Master’s degrees in Statistics? Is it worth your time to get one? Jerzy Wieczorek, mathematical statistician at the U.S. Census Bureau. discusses his thoughts on postgraduate educations for statistician.
- The Karpov vs. Kasparov rivalry holds a special place in the chess world. The duo, (arguably) the two best players ever in the history of this game, played 201 matches over almost 35 years. The following analysis (with R visualizations) show which one of the two Russians deserves to be the best of all chess players.
- One piece of advice for all of you who are in the data visualization industry: hate the default.
- In July of each year, Forbes, in partnership with the Center for College Affordability and Productivity (CCAP), produces a ranking of 650 universities in the US. Vivek H. Patil, Associate Professor of Marketing at Gonzaga University, provides some neat visuals on the Forbes University Ranking. I reviewed a book that had a wonderful chapter about all the ways that law schools cheat to improve their public rankings.
- A stick randomly breaks into 3 pieces, what is the probability that the 3 pieces can form a triangle?
- How do people die? A display of ranked causes of death, and how they’ve changed since 1990.
- If you work with time series data frequently, you should learn how to convert daily observations into weekly/monthly data in R.
26
Aug 13
The week in stats (Aug. 26th edition)
- Computing speed is often an important factor in assessing a programing language. In this post, Nathan Lemoine uses R and Python to calculate the bootstrapped confidence intervals for simulated linear regressions, and compares the computation times.
- We all know, from elementary calculus, that π is the ratio of the circumference of a circle to its diameter, and e is the base of the natural logarithm. But do you know why both of these constants appear in the density function of a normal distribution?
- Everyone (hopefully) knows how to import Excel spreadsheets into R, but do you know how you can save your R results directly as an Excel spreadsheet, with column names?
- If your chance of getting a parking ticket in one hour is 80%, what is the probability you’ll get a ticket in half an hour?
- One of the problems with Big Data is that large datasets are often proprietary and not accessible to the public. Joseph Rickert put togther a collection of some really nice big datasets that you can use to practice your R skills. They are all yours to experiment with.
- I have two children. One is a boy born on a Tuesday. What is the probability I have two boys?
- The Man Who Invented Modern Probability – the life story of Andrei Kolmogorov, by Slava Gerovitch of MIT.
10
Jul 13
Updates to types of randomness
Just a quick note that I’ve gone through and made some revisions to A classification scheme for types of randomness. If you haven’t yet read this post, I’d highly recommend it. If you have, go read it again!
15
Jun 11
The dismal science
I’ve begun reading some of the recent works by what are called “behavioral economists”. A staple of their work seems to be research into how humans fail to be perfectly rational economic actors, the most famous book of this sort being Dan Ariley’s Predictably Irrational. No doubt there is a lot of value in understanding how humans tend to deviate from behavior we (or, perhaps, academics) might expect. At the same time, I see many of these experiments as deeply flawed, in a way directly related to these economists’ failures to understand probability. In particular, they seem incapable of understanding the (often very rational) role that uncertainty plays in the minds of the participants. You can think of this uncertainty is as subjective probability, related to our degrees of belief. As human beings, we all have invisible, imperfect Bayesian calculators in our heads which crunch the data from our world and make implicit judgments about the information we take in. Right now, as you read this, how much credibility does what I’m saying have in your mind? How would your “uncertainty” about my arguments change if I made a clear mistakeee?
To see where the economists fail, consider the following experiment: A stranger approaches you and offers to give you $100 in cash right now, or to pay you $1000 in exactly one year. I can say right away that I would pocket the $100. To an economist, this would mean that I have an (implied) internal rate of interest of 1000% per annum, since $100 right now is equal in my mind to $1000 in a year. From there, the economist could easily ask me a few other questions to show that my internal rate of return isn’t really 1000%, in fact it’s all over the pace. My preferences are fully inconsistent and therefore irrational.
But is my behavior really all that irrational? In taking the $100 now, what I’ve really done is an implicit probability calculation. What is the chance that I will actually get paid that $1000 in a year? $100 in my hand right now is simple. A payment I have to wait a year for is complicated. How will I receive it? Who will pay out? How many mental resources will I spend over the course of the year thinking (or worrying) about this $1000 payment from an unknown person? Complexity always adds uncertainty; the two cannot be disentangled. The economist has failed to understand people’s (rational) uncertainties, and has ignored the psychological cost of living with that uncertainty, especially over long periods of time.
Here’s another experiment. Imagine you asked your neighbor to look after your dog for you while you were gone for the weekend. How much compensation might she expect? If she’s particularly sociable, she might be willing to look after your dog for free, or be happy with a $50 payment. But now imagine you offered her $2000 right away, would she accept that? If not, than she has what economists call an downward sloping supply curve: giving her more money leads to less of the same service. Downward sloping supply curves, especially on the personal (micro) level, get economists all hot and bothered. They seem incoherent and rife with opportunities for exploitation.
Again though, is this really a case of irrational behavior? All things being equal (a deadly assumption that’s often made by economists), there’s no doubt that your neighbor would prefer $2000 to $50 for providing the same service. But of course in this example all things aren’t equal. The amount you offer her is a signal. It tells her something about your assessment of the underlying value of the service you are requesting. $50 tells her that you appreciate the minor inconvenience of caring for your poodle. $2000 tells her that something screwy is going on. Is your dog a terror? Will it chew up her furniture? Pee everywhere? Is there some kind of legal issue that she has no idea about? The key here is the importance of conditional probability. Specifically, what is the difference in the probability that taking care of this dog is equivalent to stepping into a mine field, given that $50 is being offered, versus given that $2000 is being offered? Human beings in general have incredibly sophisticated minds, capable of spotting hidden uncertainties and performing fuzzy, but essentially correct Bayesian updates of our prior beliefs given new information. Unfortunately, such skills seem to be lacking from many modern economists.
5
Apr 10
R: Clean up your environment
I’ve started using this one quite often. Over time your environment fills up with objects, then when you run a script you don’t know if an error or unexpected result is related to an existing object in your environment.
Use with caution since it will remove all of your working data.
rm(list = ls())
5
Apr 10
Pop-up a choose file dialog box
datafilename <- file.choose()
myData  <- read.table(datafilename,header=TRUE)
16
Mar 10
>An error I got
>
Error in -value : invalid argument to unary operator
The problem was that I had the following code
fcnName <<-- value
Check out the extra dash typo, since R gives you no line numbers with the errors it took me a bit to track this down. Note the double << makes the assignment global in scope.


