- Are you a self-taught “scientist programmer”? Here is why people think code written by people like you is ugly.
- As always, R articles are extremely popular. This week, we have: Facebook teaches you exploratory data analysis with R by Revolution Analytics, Beyond R, or on the Hunt for New Tools by Quintuitive, Bootstrap Critisim (with example) by Eran Raviv, The apply command 101 by Learning R by Imitation, and Can We do Better than R-squared? by Learning as You Go.
- Julia is a new programming language (only 2 years old) for scientific computing and it has gained lots of popularity recently. In the past, we shared some articles comparing R and Julia. This week, Alvaro Galindo writes another comparison called Julia versus R – Playing around.
- Sébastien Bubeck, assistant professor at Princeton, releases the first draft of his monograph based some old lecture notes called Theory of Convex Optimization for Machine Learning.
- And finally, happy Victoria Day to those in Canada!
Uncategorized
19
May 14
The week in stats (May 19th edition)
12
May 14
The week in stats (May 12th edition)
- Looking for a job? Here are some jobs compiled by R-bloggers that may be of interest to you.
- Homer White, professor of mathematics at Georgetown College, shares his Five Reasons to Teach Elementary Statistics With R.
- Seven R Quirks That Will Drive You Nutty.
- Some popular R articles this week are: how to build a sales dashboard with R, Optimising your R code, and Modelling seasonal data with GAMs.
- And finally, Xi’an discusses bridging the gap between machine learning and statistics.
5
May 14
The week in stats (May 5th edition)
- Popular R articles this week are: colormap by Dan Kelley (Professor of Oceanography at Dalhousie University), The new look of learning R by DataCamp, Writing an R package from scratch by Hilary Parker (Data Analyst at Etsy), Test coverage of the 10 most downloaded R packages by Quartz Bio, How to Code Something ‘New’ in R by Francis Smart (PhD student at Michigan State University) and Reading large data tables in R by Fabio Marroni.
- If you roll a fair die 6 times, what is the probability that there is at least one pair of identical consecutive face values?
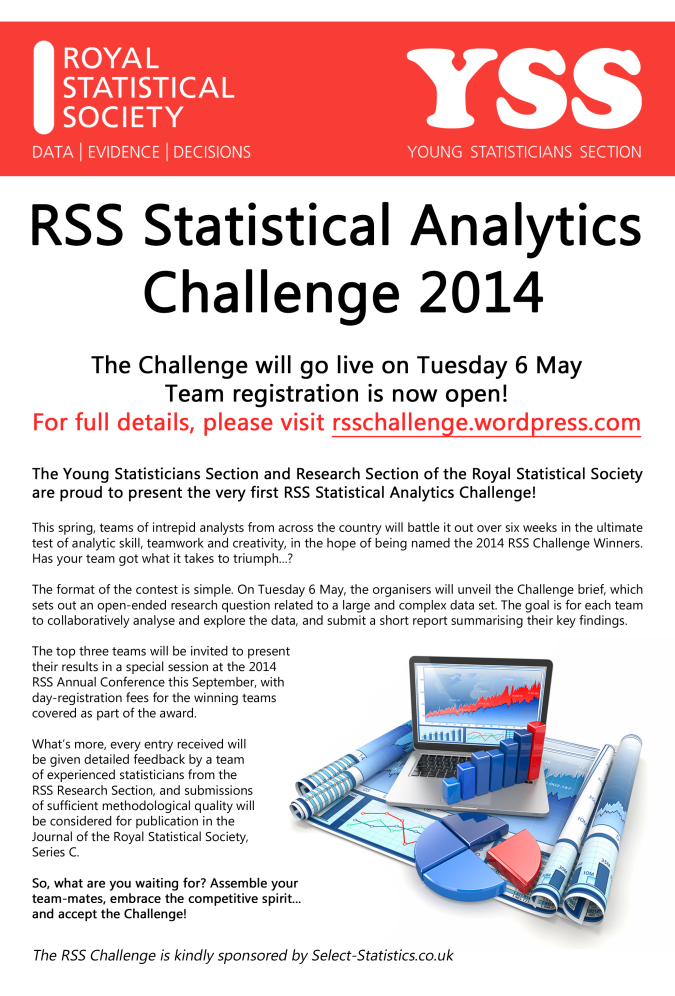
- Great news! The RSS is setting a data analysis challenge this year. The top three teams will be invited to present their results in a special session at the RSS Annual Conference in September 2014, and submissions will be considered for publication in the Journal of the Royal Statistical Society, Series C. If you are interested, here are the details.
- And finally, do you fly frequently? If so, you may want to know how to Automatically Scrape Flight Ticket Data Using R and Phantomjs.
28
Apr 14
The week in stats (April 28th edition)
- Two pieces of interesting data visualization work attracted some attention this week. How Americans Die by Matthew Klein of Bloomberg Visual Data and The Music America’s Listening To by Chris Kolmar of Movoto Blog.
- Popular R articles of the week are: Testing for Linear Separability with Linear Programming in R by Raffael Vogler, Twitter Extraction by Ethan Fosse, Simpson’s Paradox Is Back by Mad (Data) Scientist, and Object Oriented Programming with R: An example with a Cournot duopoly by Bruno Rodrigues.
- Have you ever tried Julia or have considered adopting it? Econometrics by Simulation reviews Julia from an R user’s perspective for those who are interested in learning this programming language.
- Rapport summarizes some key metrics about the popularity of R like the number of R Foundation members per country all over the world, and presents his findings in a report called R activity around the world.
- And finally, Why are R users so damn Stingy?!
21
Apr 14
The week in stats (April 21st edition)
- Do you know anything about the Hilbert Matrix (other than it is probably named after David Hilbert)? In his post this week, Nicholas Horton, Professor of Statistics at Amherst College, explains what it is, and how to create these matrices using both SAS and R.
- Xi’an discusses a new paper by Randal Douc, Florian Maire, and Jimmy Olsson called MCMC for sampling from mixture models.
- Some popular statistical articles this week are: Modeling Data With Functional Programming In R by Cartesian Faith, Make your ggplots shareable, collaborative, and with D3 by Matt Sundquist, Implementing a Principal Component Analysis (PCA) by Sebastian Raschka (for Python), and Ordering Datasets Alphabetically by geomorph.
- And finally, have you ever tried the popular mobile game 2048? If not, here are some code that you can run on your machine and start playing the game with R.
14
Apr 14
The week in stats (April 14th edition)
- R 3.1.0 (codename “Spring Dance“) is released this week!
- Do you invest in the stock market? If so, you may know the so-called 60/40 rule (invest 40% in bonds and 60% in stocks). But do you really believe this strategy? Eran Raviv performs some simulation studies and tries to verify whether the 60/40 rule is a wise choice or simply a myth.
- Popular R articles of the week: “Pretty” table columns and Calculating confidence intervals for proportions by Alan Haynes (Insights of a PhD student), Interpreting interaction coefficient in R by Lionel H. (biologyforfun) and Extract CSV data from PDF files with Tabula by Nathan Yau (Flowingdata).
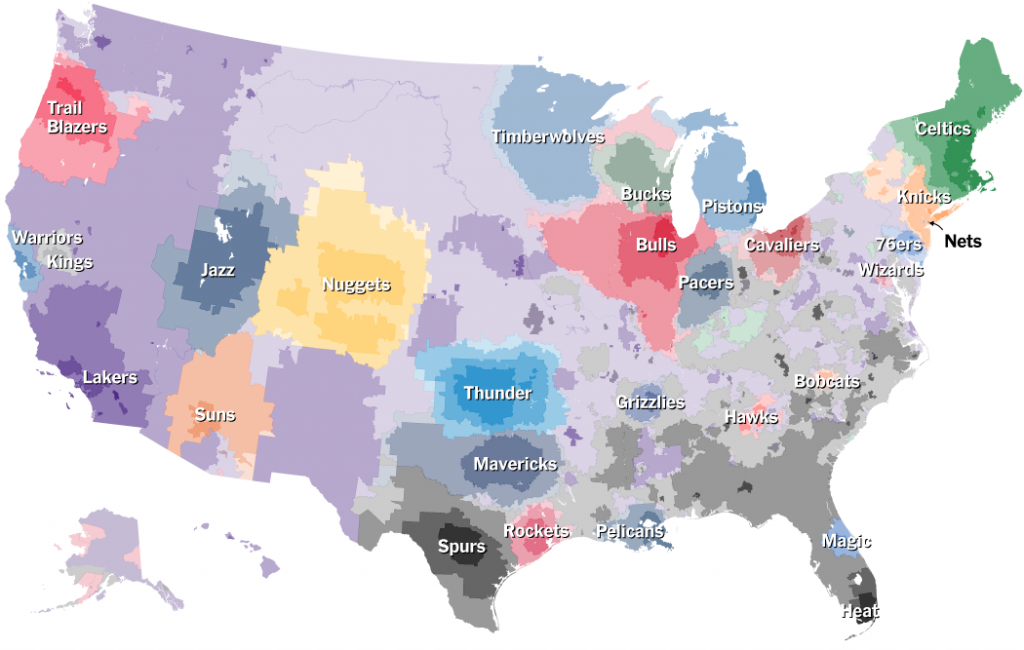
- And finally, the most loyal fans in the NBA are…
7
Apr 14
The week in stats (April 7th edition)
- To give this year’s April Fools’ day a more analytical touch, here are The 7 Funniest Data Cartoons.
- Xi’an discusses a new paper by Scott Schmidler and his Ph.D. student Douglas VanDerwerken called Parallel MCMC.
- Tim Harford of Financial Times shares his thoughts on Big Data in an article called Big data: are we making a big mistake?
- David Springate publishes three very useful R articles this week: Develop in RStudio, run in RScript, Functional programming in R, and Two R tutorials for beginners.
- And finally, Revolution Analytics summarizes some recent news and reports on how the rise of the “R” computer language brings open source to science.
31
Mar 14
The week in stats (Mar. 31st edition)
- Are you a fan of Wes Anderson? Revoluntion Analytics shares some ideas on how you can bring his style to your own R charts, by making use of these Wes Anderson inspired palettes.
- Given 3 random variables X, Y and Z with known distributions, can you calculate cov(X, Y) from cov(X, Z) and cov(Y, Z)?
- Some useful R tips this week are: Filtering Data with L1 Regularisation, quickly calculating summary statistics from a data frame, A Simple Introduction to the Graphing Philosophy of ggplot2, and Visualizing principal components with R and Sochi Olympic Athletes.
- Xi’an reviews Bayesian Data Analysis by Andrew Gelman, John Carlin, Hal Stern, David Dunson, Aki Vehtari, and Don Rubin.
- And finally, Nathan Yau of FlowingData presents some visuals from a study on smoking prevalence from 1996 to 2012, and concludes that smoking rate is inversely proportional to income level.
24
Mar 14
The week in stats (Mar. 24th edition)
- James Paul Peruvankal of Revoluntion Analytics shares the secrets of teaching R. Joseph Rickert of the same organization publishes some online sources to download data sets in his article called Data Sets for Data Science.
- Some interesting R related articles this week are: Species occurrence data by Karthik Ram of rOpenSci, barplot with ggplot2 by Martin Johnsson (PhD student at Linköping University), Stop using bivariate correlations for variable selection and The German Tank Problem: The Frequentist Way by Jacob Simmering (PhD student at University of Iowa), MCMC for Econometrics Students by Professor David Giles of University of Victoria (part I, part II and part III), Normality and Testing for Normality by Thomas Hopper (aka Learning as You Go), and It is time for RData files to become the standard for Data Transfer by Francis Smart (PhD student at Michigan State University).
- Xi’an discusses his new paper (with Matthew Moores and Kerrie Mengersen) called Pre-processing for approximate Bayesian computation in image analysis.
- And finally, the Royal Statistical Society publishes the Timeline of Statistics – a timeline with illustrations and texts that covers major events in the world of statistics starting from 450 BC.
17
Mar 14
The week in stats (Mar. 17th edition)
- R 3.0.3 is release (with installation and upgrading instructions and a list of updates, bug fixes and changes).
- Suppose a company has 5 servers, and there is a 1% chance that each server will be down. What is the probability that at least 3 servers are down?
- Mikio L. Braun, a PostDoc in machine learning at TU Berlin and co-founder and chief data scientist at streamdrill, discusses the difficulties of data analysis.
- Xi’an comments on a new paper by his PhD student called Approximate Integrated Likelihood via ABC methods.
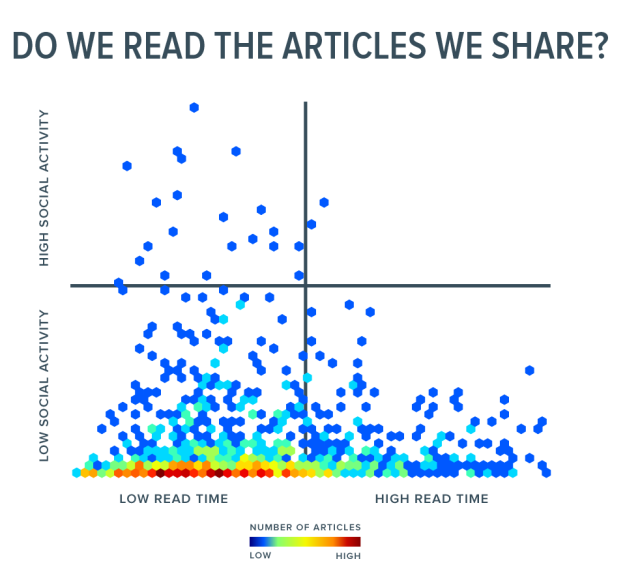
- How people really read and share online.
- Joseph Rickert of Revolution Analytics publishes his R “meta” book, a collection of 14 books (all available online for free) that covers useful topics including basic probability and statistics, regressions, experimental design, survival analysis, times series analysis and forecasting, machine learning, bioinformatics, structural equation models and credit scoring.
- And finally, Flavio Barros compiles a list of MOOC courses on R.


 The German “Tank” Problem