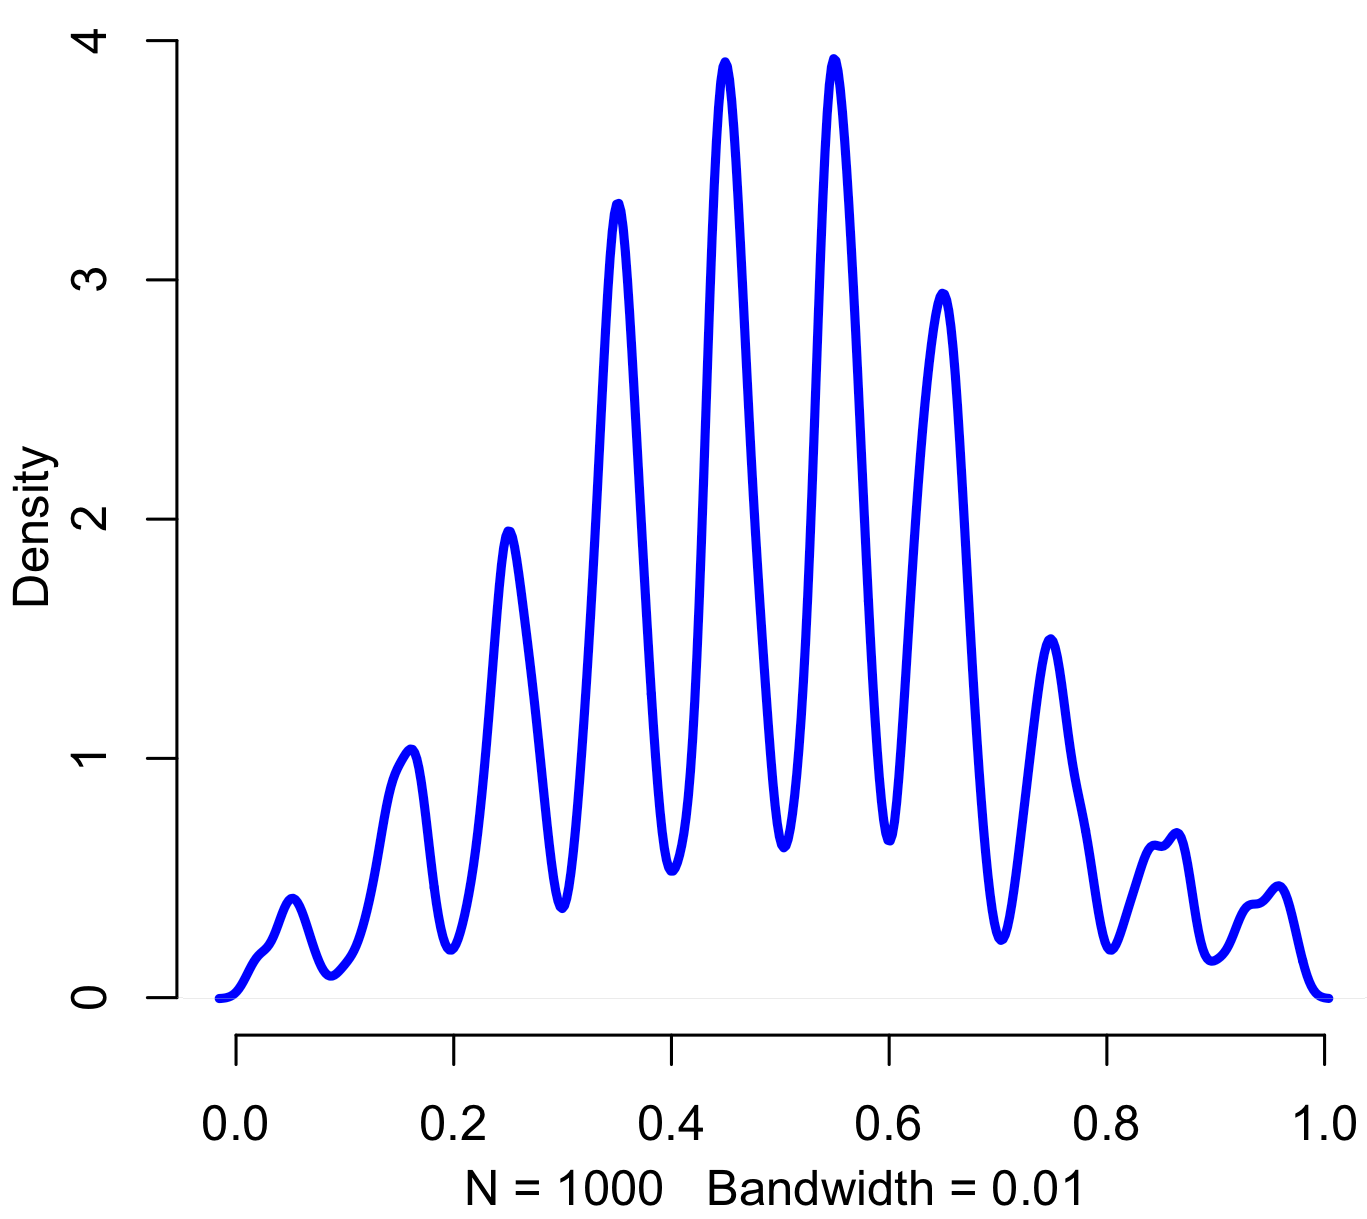
Pinned, entropy augmented, digitally normal distribution, of no particular work-related use and thus perfectly suitable for today. Code in R:
iters = 1000
sd = 2
precision = 20

results = rep(0,iters)

for(i in 1:iters) {
	x = floor(rnorm(20,5,sd) %% 10)
	results[i] = paste(c('.',x),sep="",collapse="")
}

results = as.numeric(results)

plot(density(results,bw=.01),col="blue",lwd=3,bty="n")

