- Are you a fan of Wes Anderson? Revoluntion Analytics shares some ideas on how you can bring his style to your own R charts, by making use of these Wes Anderson inspired palettes.
- Given 3 random variables X, Y and Z with known distributions, can you calculate cov(X, Y) from cov(X, Z) and cov(Y, Z)?
- Some useful R tips this week are: Filtering Data with L1 Regularisation, quickly calculating summary statistics from a data frame, A Simple Introduction to the Graphing Philosophy of ggplot2, and Visualizing principal components with R and Sochi Olympic Athletes.
- Xi’an reviews Bayesian Data Analysis by Andrew Gelman, John Carlin, Hal Stern, David Dunson, Aki Vehtari, and Don Rubin.
- And finally, Nathan Yau of FlowingData presents some visuals from a study on smoking prevalence from 1996 to 2012, and concludes that smoking rate is inversely proportional to income level.
March, 2014
31
Mar 14
The week in stats (Mar. 31st edition)
24
Mar 14
The week in stats (Mar. 24th edition)
- James Paul Peruvankal of Revoluntion Analytics shares the secrets of teaching R. Joseph Rickert of the same organization publishes some online sources to download data sets in his article called Data Sets for Data Science.
- Some interesting R related articles this week are: Species occurrence data by Karthik Ram of rOpenSci, barplot with ggplot2 by Martin Johnsson (PhD student at Linköping University), Stop using bivariate correlations for variable selection and The German Tank Problem: The Frequentist Way by Jacob Simmering (PhD student at University of Iowa), MCMC for Econometrics Students by Professor David Giles of University of Victoria (part I, part II and part III), Normality and Testing for Normality by Thomas Hopper (aka Learning as You Go), and It is time for RData files to become the standard for Data Transfer by Francis Smart (PhD student at Michigan State University).
- Xi’an discusses his new paper (with Matthew Moores and Kerrie Mengersen) called Pre-processing for approximate Bayesian computation in image analysis.
- And finally, the Royal Statistical Society publishes the Timeline of Statistics – a timeline with illustrations and texts that covers major events in the world of statistics starting from 450 BC.
17
Mar 14
The week in stats (Mar. 17th edition)
- R 3.0.3 is release (with installation and upgrading instructions and a list of updates, bug fixes and changes).
- Suppose a company has 5 servers, and there is a 1% chance that each server will be down. What is the probability that at least 3 servers are down?
- Mikio L. Braun, a PostDoc in machine learning at TU Berlin and co-founder and chief data scientist at streamdrill, discusses the difficulties of data analysis.
- Xi’an comments on a new paper by his PhD student called Approximate Integrated Likelihood via ABC methods.
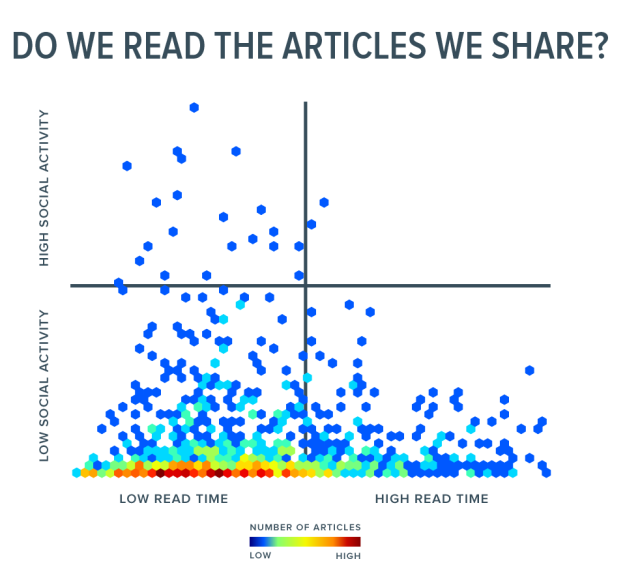
- How people really read and share online.
- Joseph Rickert of Revolution Analytics publishes his R “meta” book, a collection of 14 books (all available online for free) that covers useful topics including basic probability and statistics, regressions, experimental design, survival analysis, times series analysis and forecasting, machine learning, bioinformatics, structural equation models and credit scoring.
- And finally, Flavio Barros compiles a list of MOOC courses on R.
10
Mar 14
The week in stats (Mar. 10th edition)
- A historian, a data scientist, a programmer, a mathematician, and a philosopher discuss the question How likely it is that a lottery draw (6 out of 49) contains two consecutive numbers.
- Suppose that A, B, and C are uniformly distributed on [0, 1], what is the probability that the equation [latex] Ax^2 + Bx + C [/latex] has real root(s)?
- Dimiter Toshkov of Rules of Reason presents Predicting movie ratings with IMDb data and R and suggests a different way of awarding the Academy Awards based on statistics.
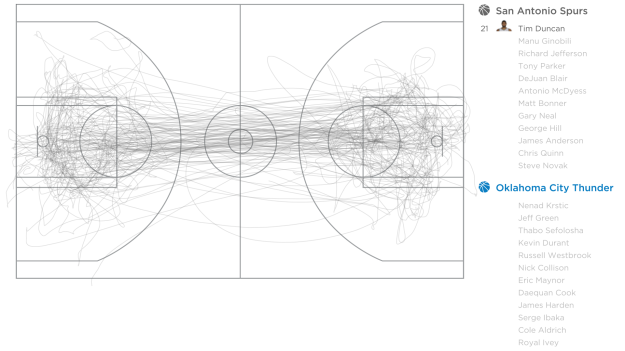
- Visualized related articles are always liked by our readers. This week, we have: Plotting an Odd number of plots in single image, Beautiful table outputs in R, Visualizations on the Monopoly board, and Basketball movements visualized.
- Xi’an reviews Bayesian Programming by Pierre Bessière, Emmanuel Mazer, Juan-Manuel Ahuactzin, and Kamel Mekhnacha.
- Ever wonder how popular your favorite R functions are? Check out the Function Counter for R.
- And finally, Rasmus Bååth shares easy ways to create matrices in R.
3
Mar 14
The week in stats (Mar. 3rd edition)
- Like almost every week, R articles attract lots of attention from readers. This week, we have: Quick and dirty notes on General Linear Mix Models, How to Make a Bad Password with R, rMaps and the Mexico map, How to Read Histograms and Use Them in R, Useful Functions in R for Manipulating Text Data, and Simply creating various scatter plots with ggplot.
- r4stats.com publishes a detailed report on various ways of measuring the popularity or market shares of approximately 30 software packages for analytics, including well-known names such as R, Matlab, SAS, SPSS, Stata, Python.
- Quintuitive discusses his experience and thoughts after using RStudio for one year.
- Xi’an reviews two new books this week, the first one is called Nonlinear Time Series by Randal Douc, Éric Moulines and David Stoffer, and the second is called Foundations of Statistical Algorithms by Claus Weihs, Olav Mersman and Uwe Ligges.
- If you are an active stock investor, you should consider Using CART for Stock Market Forecasting.
- And finally, Nathan Yau of FlowingData explains the statistical reasoning behind why you should buy the bigger pizza.


 The German “Tank” Problem

