- Last Monday (Feb. 17th) was R.A. Fisher’s birthday. To honor him, Deborah G. Mayo, Professor of Philosophy at Virginia Tech, publishes Fisher and Neyman after anger management, and R.A. Fisher: ‘Two New Properties of Mathematical Likelihood’.
- A few articles related to visualization and graphics received lots of attention: ggplot2: Cheatsheet for Visualizing Distributions, Automatically coloring your R output in the terminal using colorout, A visual explanation of conditional probability, R: Fun with surf3D function and No need for SPSS – beautiful output in R.
- Given that you have a five-card hand with ♠K and ♡K, what is the probability that you have all four Kings?
- Coursera offers a new MOOC course called Data Analysis for Genomics. The course starts on April 7, 2014.
- And finally, Arthur Charpentier (aka Freakonometrics) publishes a technical article called Identification of ARMA processes.
February, 2014
24
Feb 14
The week in stats (Feb. 24th edition)
17
Feb 14
The week in stats (Feb. 17th edition)
- Professor Roger Peng of the Johns Hopkins Bloomberg School of Public Health discusses the meaning of Reproducible Analysis, why it is important, and how to ensure that your R analysis is reproducible.
- A recent survey by Revolution Analytics show that R language skills attract median salaries in excess of $110,000 in the United States.
- Last week, many helpful R articles attracted attention from readers. A million ways to connect R and Excel, efficiency of Importing Large CSV Files in R, R framework with Object-Oriented Programming, ggplot Fit Line and Lattice Fit Line in R, and Interactive maps with R.
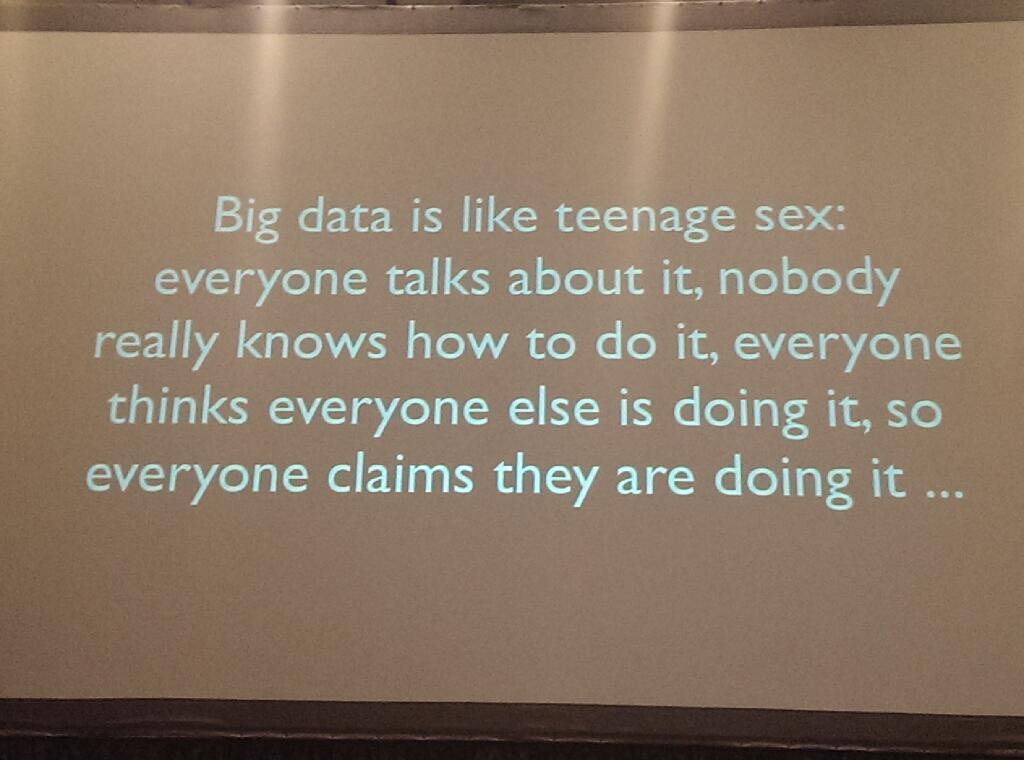
- Big Data is a popular term that everyone in almost every field discusses, however, Stephen Turner, assistant professor of public health sciences and director of the Bioinformatics Core at the University of Virginia, argues that There is no Such Thing as Biomedical “Big Data”.
- Welcome to the age of Databall – the rise of analytics usage in the NBA.
- And finally, suppose that you pick a random interger from 0 to 1000. Given that this integer is divisible by 4, what is the probability that it is also divisible by 3?
10
Feb 14
The week in stats (Feb. 10th edition)
- The latest survey conducted by RedMonk shows that R is 15th of top programming languages.
- Simplex Regression (a technique that minimizes the absolute error of residuals rather than squared error) is an alternative to traditional least squares because it is resistant to outliers in the data, and helpful in studies where outliers may be safely and effectively ignored. This week, WenSui (文穗) teaches how to fit simplex regressions in R.
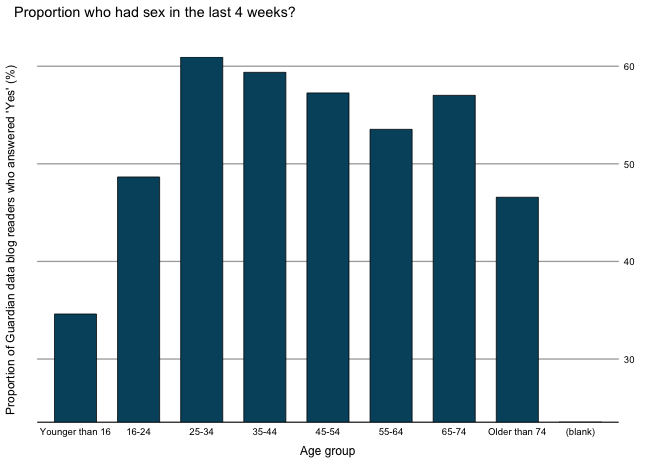
- Does sexual activity change with age?
- Eran Raviv continues the R vs. Matlab comparison. This week, R wins the second round and we are tied at 1-1.
- A brief review of R Studio and “Advanced R Development”
- And finally, Joseph Rickert of Revolution Analytics presents a tutorial on analyzing weather data using his new R package weatherData.
3
Feb 14
The week in stats (Feb. 3rd edition)
- The Odds Ratio is a confusing but unavoidable statistic which comes up in both scientific and non-scientific articles. In a recent short paper published in the British Medical Journal, Robert Grant explains why it confuses people and how it should be interpreted.
- Last week, many helpful R articles attracted attention from readers. Comparisons of R vs. Matlab, and R vs. Python, how to compare multiple (g)lm in one graph, working with time series data sources, Princeton’s guide to linear modeling and logistic regression with R, and A First Look at rxDForest() – an R classification and regression tree package.
- Xi’an discusses a recent paper by Chris Drovandi and Tony Pettitt called Bayesian indirect inference.
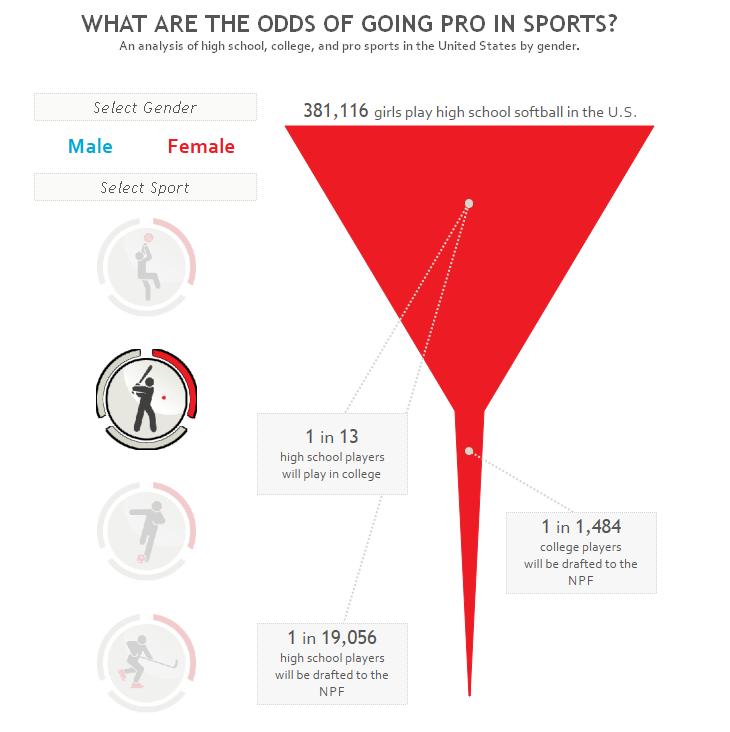
- What are your chances of making it to the big leagues? Ryan Sleeper created an interactive visualization to show the odds for different sports. Choose wisely: for a high school athlete your chances can be as high as one in 170 or as low as 1 in 19,056.


