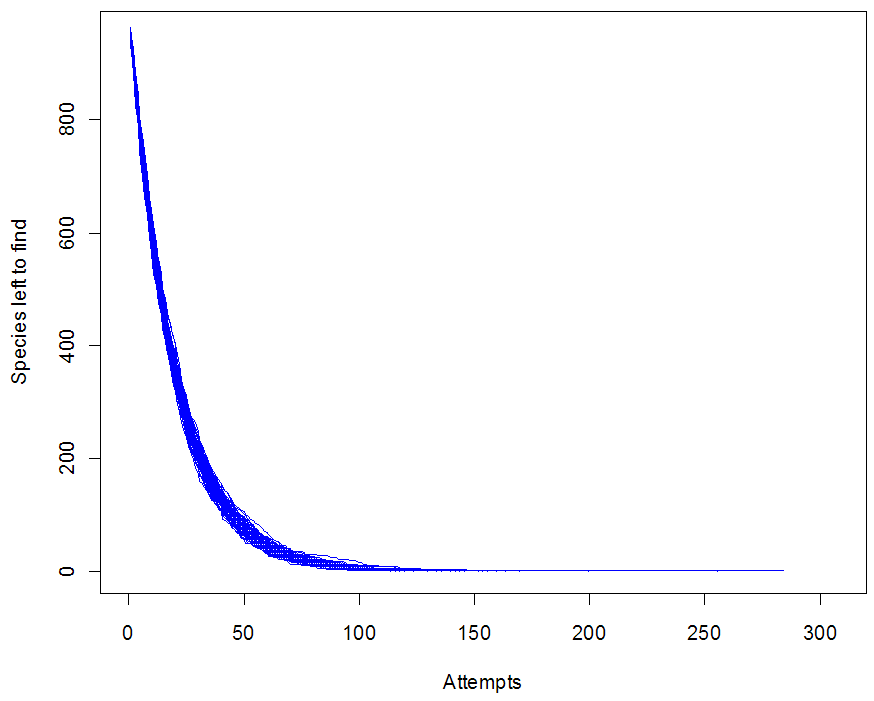
Let’s say your goal is to observe all known species in a particular biological category. Once a week you go out and collect specimens to identify, or maybe you just bring your binoculars to do some spotting. How long will it take you to cross off every species on your list?
I’ve been wondering this lately since I’ve begun to hang out on the Mushrooms of Québec flickr group. So far they have over 2200 species included in the photos. At least one of the contributors has written a book on the subject, which got me wondering how long it might take him to gather his own photos and field observations on every single known species.
My crude model (see R code at the end of this post) assumes that every time Yves goes out, he has a fixed chance of encountering every given species. In other words, if there were 1000 species to find, and he averages 50 species per hunt, then every species is assigned a 1/20 chance of being found per trip. Thus the total found on any trip would have a Poisson distribution with parameter 50.
This model is unrealistic for lots of reasons (can you spot all the bad assumptions?), but it does show one of the daunting problems with this task: the closer you get to the end, the harder it becomes to find the last few species. In particular, you can be stuck at 1 for a depressingly long time. Run the simulation with different options and look at the graphs you get. I’m calling this “The unicorn problem,” after Nic Cage’s impossible-to-rob car in the movie Gone in 60 Seconds.
Do you have a real-life unicorn of one sort or another?
species = 1000
findP = 1/20
trials = 100
triesToFindAll = rep(0, trials)


for(i in 1:trials) {
	triesNeeded = 0

	leftToFind = rep(1, species)
	leftNow = species
	numberLeft = c()

	while (leftNow > 0) {

		found = sample( c(0,1), 1000, replace=TRUE, prob = c((1-findP),findP))

		leftToFind = leftToFind - found

		leftNow = length(leftToFind[leftToFind > 0])

		numberLeft = c(numberLeft, leftNow)

		triesNeeded = triesNeeded + 1

	}

	if(i == 1) {
		plot.ts(numberLeft, xlim=c(0, 2*triesNeeded), col="blue", ylab="Species left to find", xlab="Attempts")
	} else {
		lines(numberLeft, col="blue")
	}

	triesToFindAll[i] = triesNeeded
}
Tags: Gone in 60 Seconds, Mushrooms, Nic Cage, r


The biggest problem w the assumptions is that all species are equally likely to be encountered each time. if you made some more rare than others I bet it would take even longer to find your unicorn.
How about an even more interesting problem: Given the rate of finding new species, and “juicing” the calculation by using estimates of weights on how efficacious certain sampling places and schemes are (“importance weights”), determine how many more species remain to be found.
References for students of the matter, as I am:
http://oregonstate.edu/instruct/st571/urquhart/var_prob/sld011.htm
Overton, Stehman, “The Horvitz-Thompson Theorem as a unifying perspective for probability sampling: With examples from natural resources sampling,” THE AMERICAN STATISTICIAN, 49(3), August 1995, pp 261ff.
A. R. Solow, W. K. Smith, “Estimating species number under an inconvenient abundance model,” JOURNAL OF AGRICULTURAL, BIOLOGICAL, AND ENVIRONMENTAL STATISTICS, 14: 242-252, 2009.
DX hunting. That’s a radio amateur activity and the uniform discoverability rate you assume above does not hold at all.
@Jan Galkowski
Very interesting problem! Kind of like the German Tank Problem (http://www.statisticsblog.com/2010/05/how-many-tanks-gtp-gets-put-to-the-test/) for species. Would be interesting to test the theorem you linked with an MC simulation.
Hi, I stumbled upon your nice blog. The “unicorn problem” is related to the classic coupon collector’s problem (http://en.wikipedia.org/wiki/Coupon_collector%27s_problem), where you have n urns and at each step you place a ball into a randomly selected urn. The question is then how many balls you have to use so that every urn contains a ball. There are many generalizations of this problem, a Google search will help you find them.
The relation with your problem: instead of saying that the probability of finding a species is 1/20 at each trip, it is roughly equivalent to say that at each trip you find one (random) species, and then counting 50 trips as one (this approximation is ok, because 50 not much bigger than the square root of 1000). The expected number of trips necessary to find the 1000 species should therefore be roughly 1000 * log(1000) / 50, which is approximately 140.
Just checking at the graph: Seems to fit 🙂
You can also do the calculations directly for your model. This is actually very easy, since the random variables N_1,…,N_k,…,N_1000, where N_k is the number of trips you have to do to find species k, are independent. Each one is geometric with success probability 1/20, therefore their maximum is roughly 20*log(1000) (standard result from extreme value theory).
Hi Pascal,
Nice! Reminds me of trading cards to McDonald’s Monopoly game as a kid, trying to complete a particular set. We always suspected that they made all but the last card in a set very rare, to prevent people from winning many of the big prizes. Given that our we were just a tiny fraction of the people who collected the cards, we were effectively sampling with replacement from the overall collection.
Makes me wonder about trading, though, and how much it would increase your chances of finding your “unicorn”. Could make the simulation more interesting.