Long before I had heard about the connection between entropy and probability theory, I knew about it from the physical sciences. This is most likely how you met it, too. You heard that entropy in the universe is always increasing, and, if you’re like me, that made very little sense. Then you may have heard that entropy is a measure of disorder: over times things fell apart. This makes a little more sense, especially to those teenagers tasked with cleaning their own rooms. Later on, perhaps you got a more precise, mathematical definition of entropy that still didn’t fully mesh with the world as we observe it. Here on earth, we see structures getting built up over time: plants convert raw energy to sunflowers, bees build honeycombs, humans build roads. Things do sometimes fall apart. More precisely, levels of complexity tend to grow incrementally over long periods of time, then collapse very quickly. This particular asymmetry seems to be an ironclad rule for our word, which I assume everyone understands, at least implicitly, though I can’t remember anywhere this rule is written down as such.
In the world of probability, entropy is a measure of unpredictability. Claude Shannon, who created the field of Information Theory, gave us an equation to measure how much, or little, is known about an incoming message a prori. If we know for sure exactly what the message will be, our entropy is 0. There is no uncertainty. If we don’t know anything about the outcome except that it will be one of a finite number of possibilities, we should assume uniform probability for any one of the outcomes. Uncertainty, and entropy, is maximized. The more you look into the intersection of entropy and statistics, the more you find surprising, yet somehow obvious in retrospect, connections. For example, among continuous distributions with fixed mean and standard deviation, the Normal distribution has maximal entropy. Surprised? Think about how quickly a sum of uniformly distributed random variables converges to the Normal distribution. Better yet, check it out for yourself:
n = 4
tally = rep(0,10000)
for(i in 1:n) {
	tally = tally + runif(10000)
}

hist(tally, breaks=50, col="blue")
Try increasing and decreasing “n” and see how quickly the bell curve begins to appear.
Lately I’ve been thinking about how to take any general distribution and increase the entropy. The method I like best involves chopping off the tails and “wrapping” these extreme values back around to the middle. Here’s the function I created:
smartMod <- function(x, mod) {
	sgn = sign(x)
	x = abs(x)
	x = x %% mod
	return(sgn * x)
}
Now is a perfect time to use a version of our “perfect sample” function:
perfect.sample <- function(dist, n, ...) {
	match.fun(paste('q', dist, sep=''))((1:n) / (n+1), ...)
}
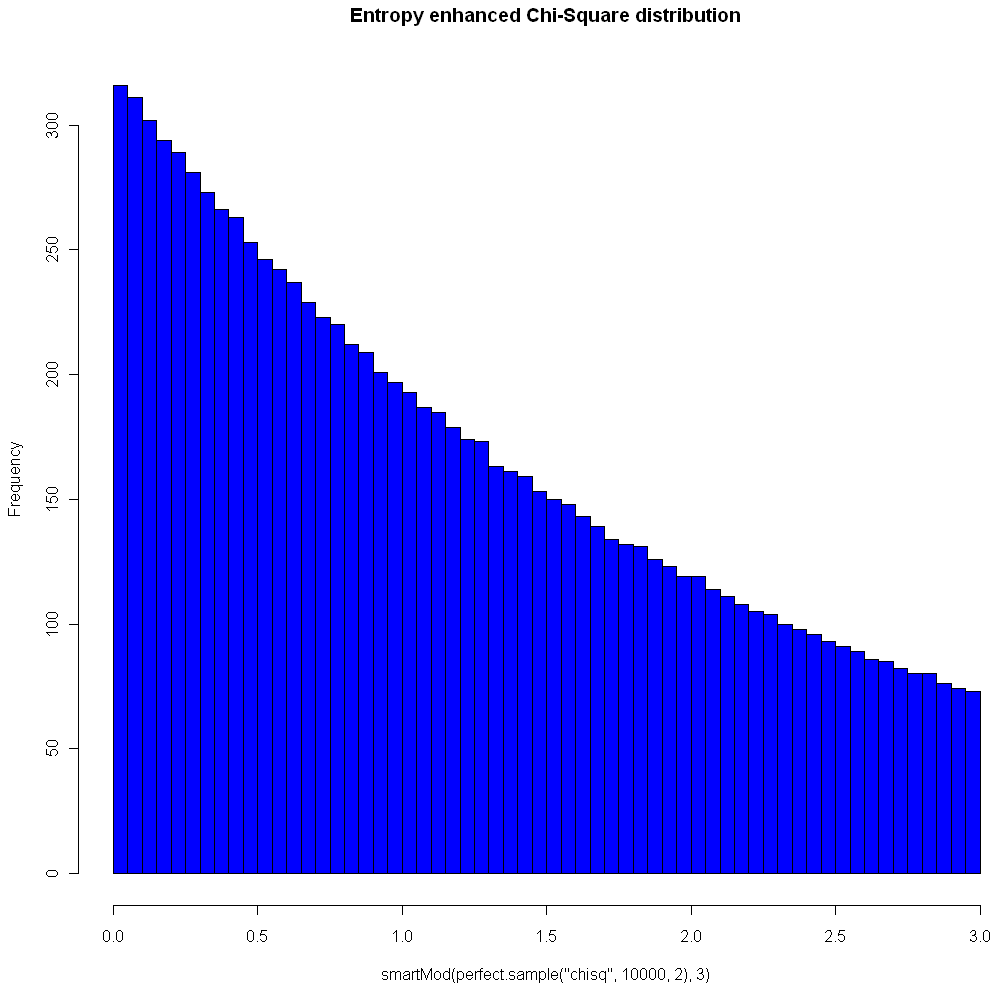
The image at the top of this post shows the Chi Square distribution on 2 degrees of freedom, with Modulo 3 Entropy Enhancement (see how nice that sounds?). Here’s the code to replicate the image:
hist(smartMod(perfect.sample("chisq",10000,2),3),breaks=70,col="blue",main="Entropy enhanced Chi-Square distribution")
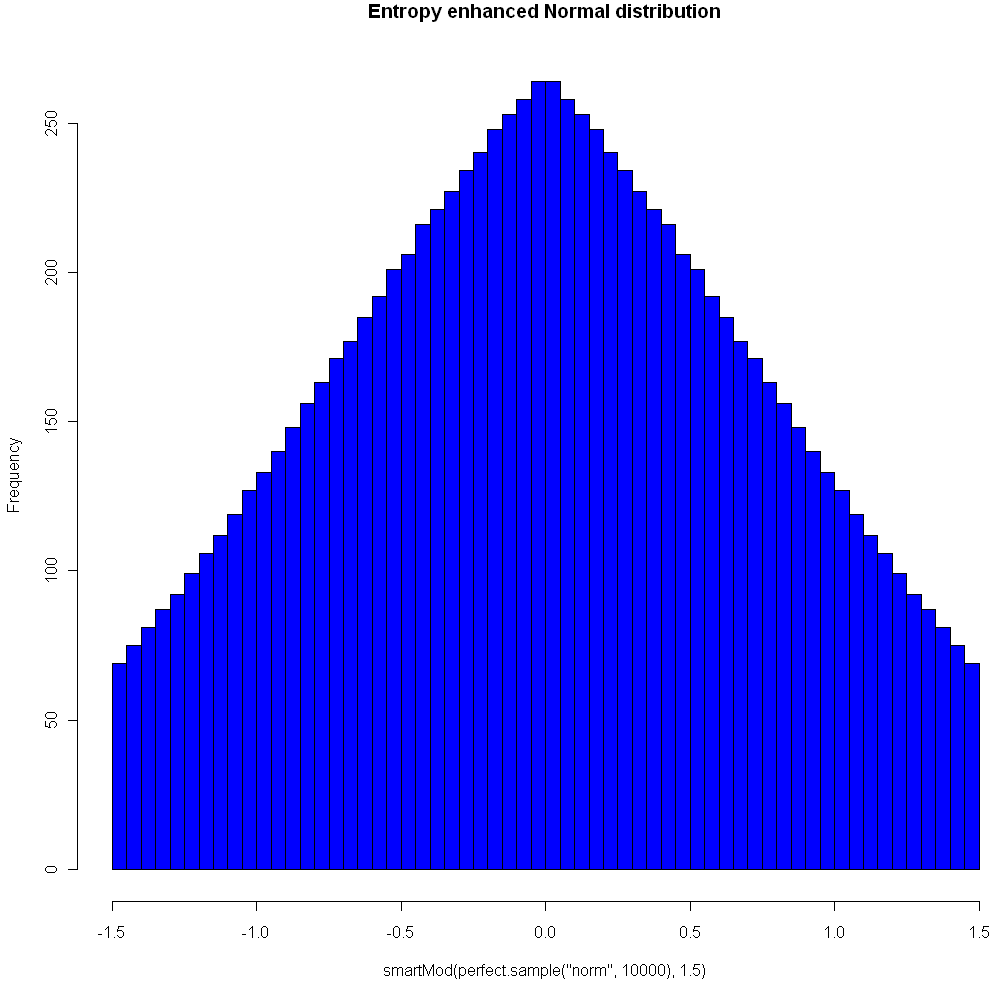
Here’s another plot, using the Normal distribution and Modulo 1.5:
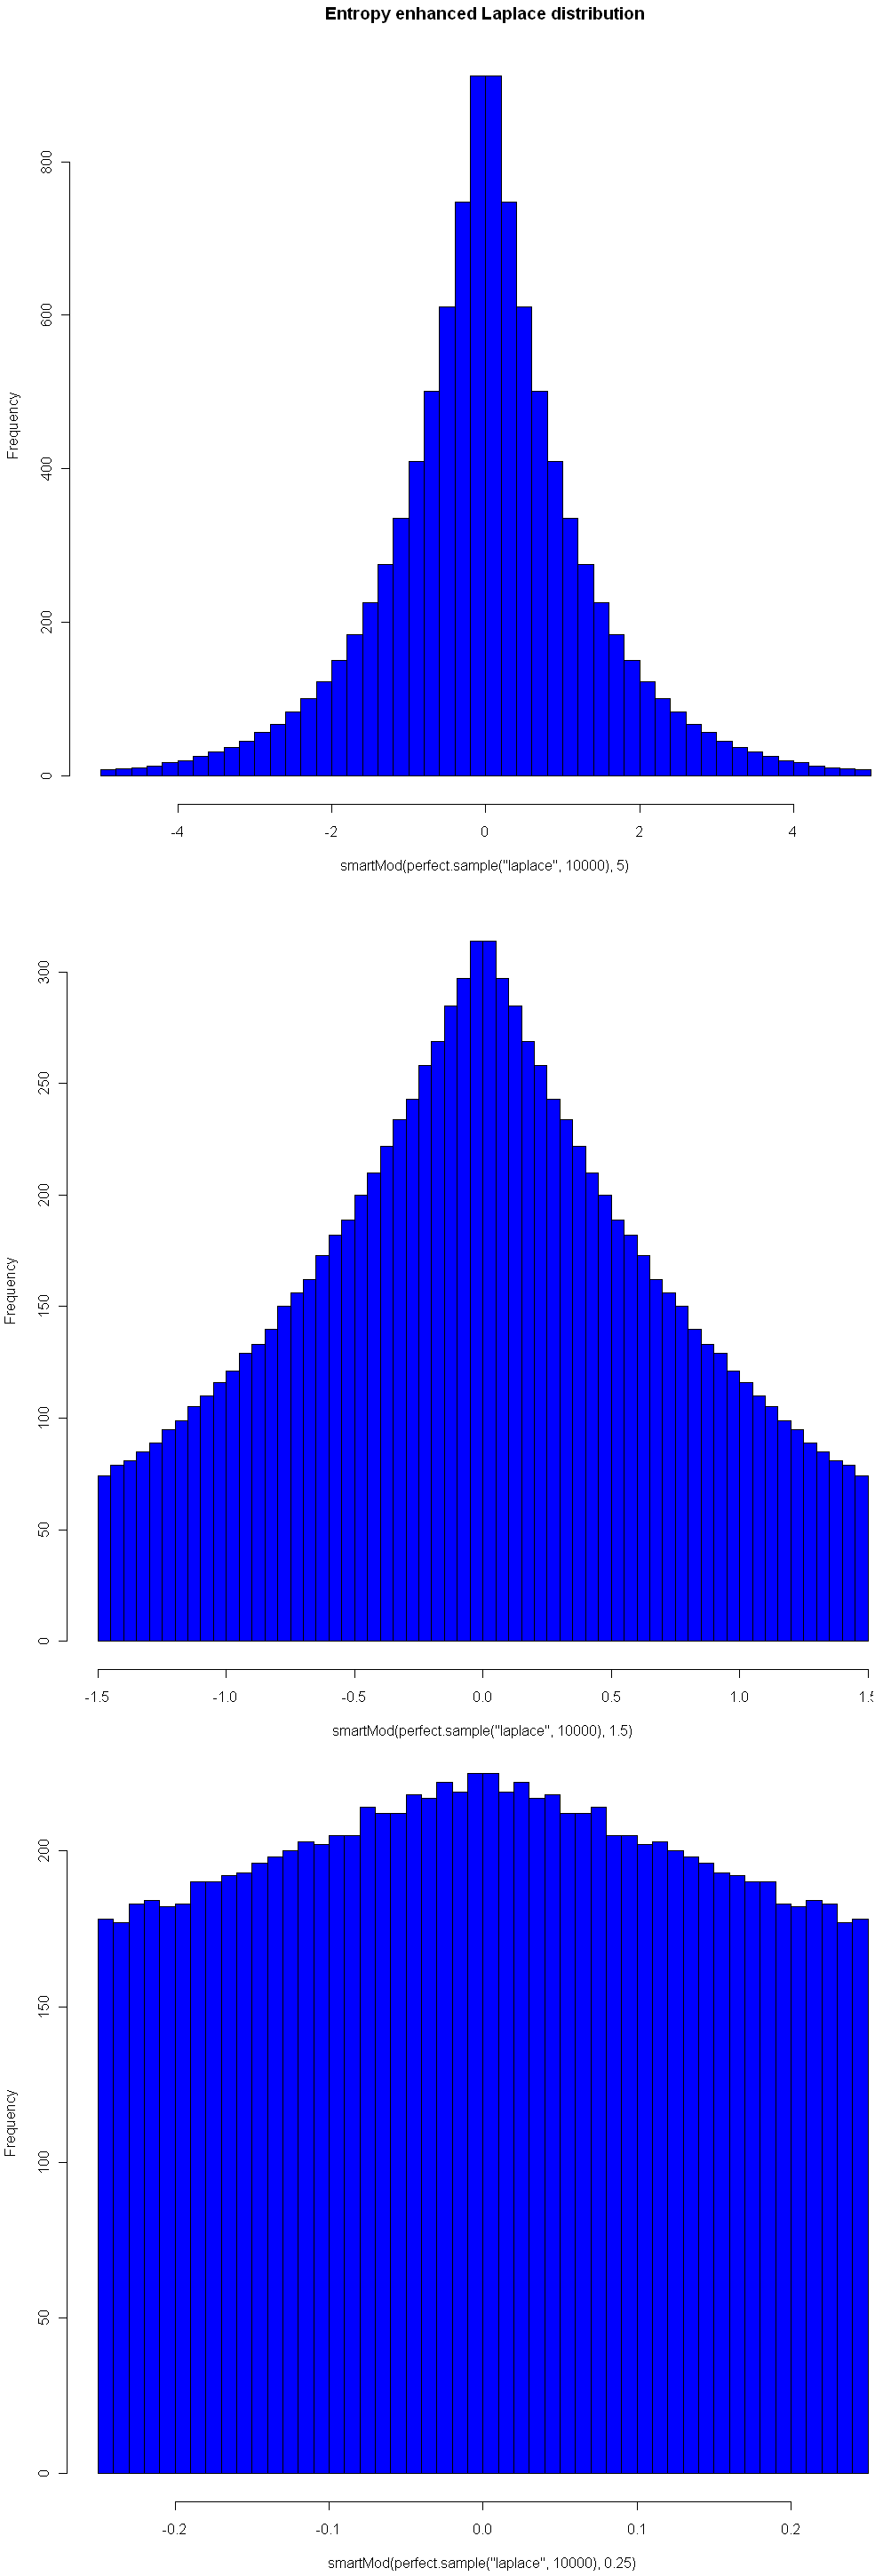
One nice property of this method of increasing entropy is that you get a smooth transition with logical extremes: As your choice of Mod goes to infinity, the distribution remains unchanged. As your Mod number converges to 0, entropy (for that given width) is maximized. Here are three views of the Laplace, with Mods 5, 1.5, and 0.25, respectively. See how nicely it flattens out? (Note you will need the library “VGAM” to sample from the Laplace).
It’s not clear to me yet how entropy enhancement could be of practical use. But everyone loves enhancements, right? And who among us doesn’t long for a little extra entropy for time to time, no?


