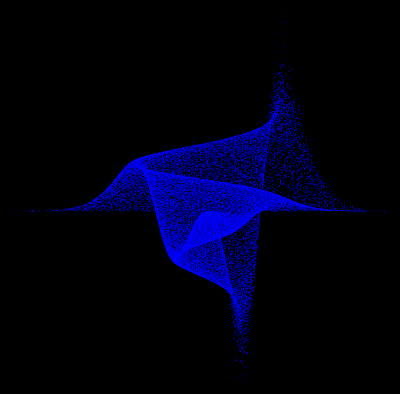
Make sure to click on the image to see the large version. Code for this graph:
moxbuller = function(n) {
	u = runif(n)
	v = runif(n)
	x = cos(2*pi*u)*sqrt(-2*log(v))
	y = sin(2*pi*v)*sqrt(-2*log(u))
	r = list(x=x, y=y)
	return(r)
}
r = moxbuller(50000)
par(bg="black")
par(mar=c(0,0,0,0))
plot(r$x,r$y, pch=".", col="blue", cex=1.2)

