I found this interesting question over here at mathoverflow.net. Here’s the question:
If you have a country where every family will continue to have children until they get a boy, then they will stop. What is the proportion of boys to girls in the country.
First off, there are some assumptions you need to make that aren’t stated in the problem. The most important one is that boys are just as likely as girls to be born. This is empirically false, but there’s nothing wrong with assuming it for the problem, so long as the assumption is acknowledged.
My first thought about solving the problem was to think about Martingales and stopping times, but that’s more complication than you need. If you look at it from the point of view of expectation things are simpler.The probability of having a boy first is 1/2, at which point the family stops and you have a ratio of 1 boy per 1 births. The probability of having one girl, then one boy is 1/4, at which point you have a ratio of 1 boy per 2 births. Multiplying the probabilities by the ratios and summing from 1 birth to infinity, you get an expectation of approximately 69.31% boys.
Problem is, this is the expectation for a single family. Because families who have more children (and thus more girls) contribute disproportionately to the pool of children, one family is a biased estimator for the proportion in the entire population. Douglas Zare at the above-linked mathoverflow question does a good job of working out the details for a country with an arbitrary number of families. Here is what he comes up with for the percentage of girls:
Where k is the number of families in the country, and ![]() is the digamma function.
is the digamma function.
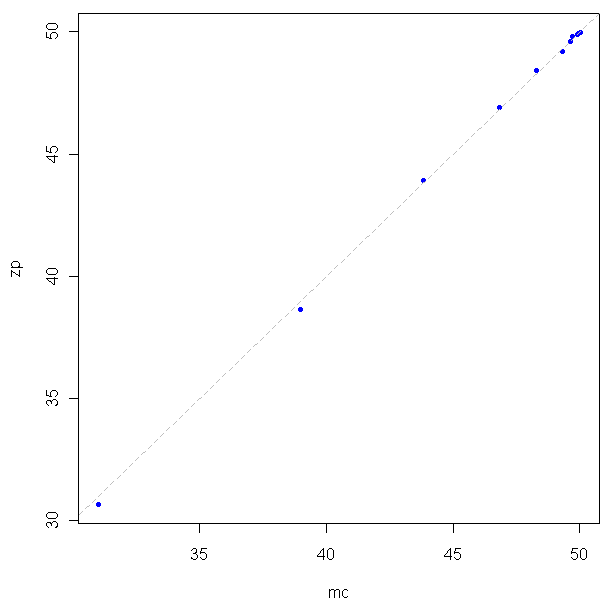
To be true to the new motto of this site, I decided to test this out in R using a Monte Carlo method. Here is my code:
And here is the resulting graph:
Looks like a good match.
Maybe you noticed that at the beginning I mentioned assumptions, as in more than one. We are also assuming that that all of the boys and girls, no matter how old, are still considered boys and girls. All of the parents were already in the country at the beginning of the problem, and then they all started having children until they had a boy and stopped. None of these children have had any children. The process is complete, and the new generation is the last. Obviously even if parents in a country did follow the rule of "babies until boy then stop", the results wouldn't match the theoretical because at any given moment there are many families in the process of still having kids. This is where, if I were so inclined or needed a more accurate model, I would dive back into the Martingale issue and things would get messy.


