Computer creations are perfect by design. We put in numbers, and if all goes well we get out an exact result. If we want a line, we want it perfectly straight. If we want a circle, it should conform to the platonic ideal of a circle. From a mathematical standpoint, these perfect shapes and precisely computed numbers are ideal.
Someday, perhaps, we will have true fuzzy computation built right into our hardware. For now, it takes considerable effort to achieve just the right level of imperfection needed for simulating mistakes, or any organic processes.
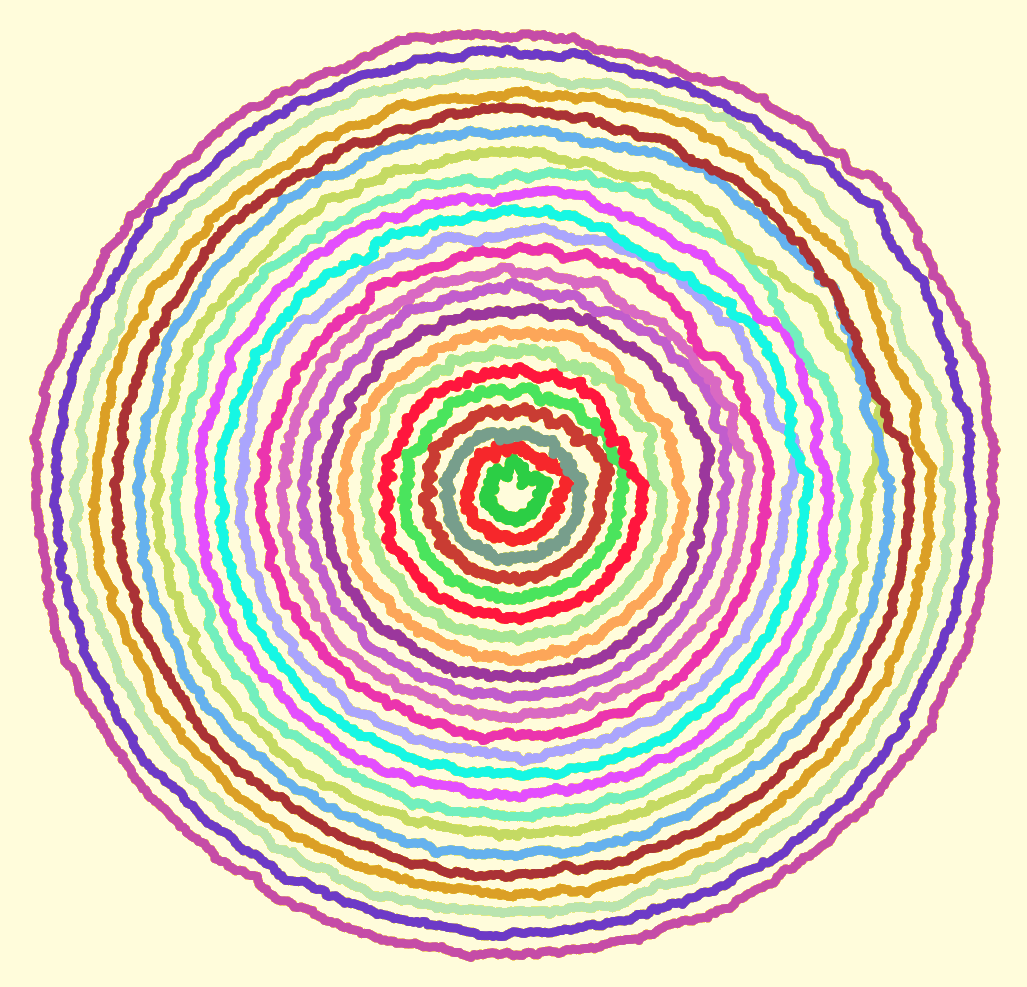
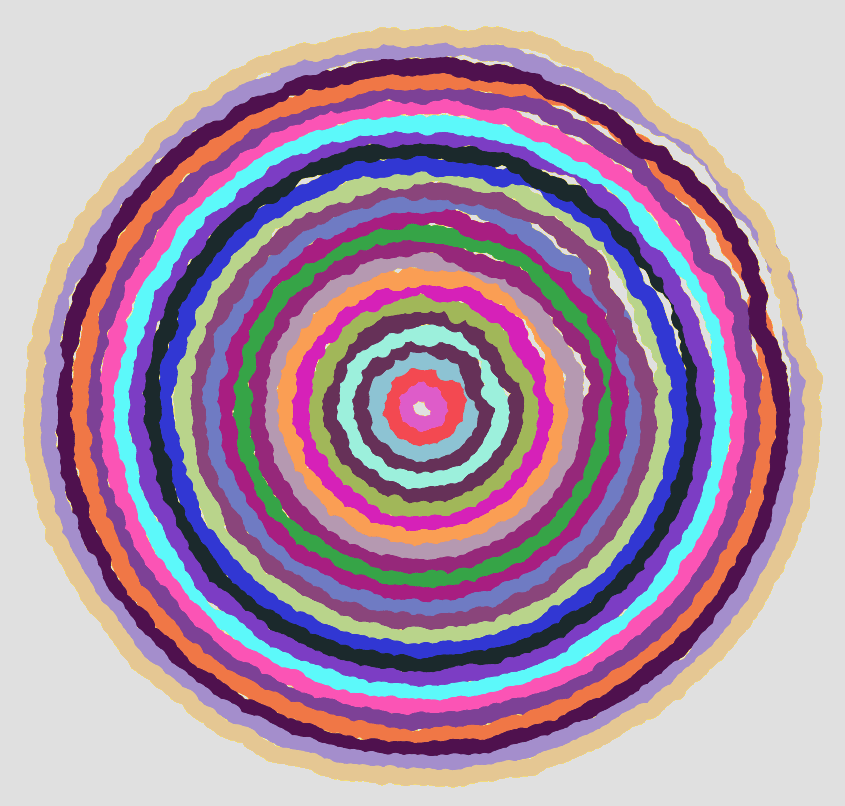
I sent each of the circles shown above on a random walk. That part was easy, getting each circle to end up where it started (and close the loop) took a bit more effort. To vary the “wigglyness” of the lines, adjust the “sd” parameter in “rnorm”. To change how quickly randomness tapers off, change the “4” in “i/4”. Here is my code:
# Circle lengths
j = seq(0.1,1.9,.08)

par(bg = "black")
plot(-2,-2,pch=".",xlim=c(-2,2),ylim=c(-2,2),col="white")

# How many dots around the circle?
dots = 1000

# Create an offkilter circle
rads = seq(0,2*pi,2*pi/dots)

for(aLength in j) {
	# Pick a random color
	myCol = paste("#",paste(sample(c(1:9,"A","B","C","D","E","F"),6,replace=T),collapse=""),collapse="",sep="")

	# Start at length = 1, then walk.
	myLength = rep(aLength,dots)

	for(i in 2:dots) {
		myLength[i] = myLength[(i-1)] + rnorm(1,0,sd=.005)

		# Closer we are to end, faster we return to where started so circle closes
		dist = aLength - myLength[i]
		myLength[i] = aLength - (dist*((dots-(i/4))/(dots)))
	}


	for(i in 1:dots) {
		cat(myLength[i]*cos(rads[i]),myLength[i]*sin(rads[i]),"\n")
		points(myLength[i]*cos(rads[i]),myLength[i]*sin(rads[i]),col=myCol,pch=20,cex=2)
	}
}
What do your circles look like?


I stumbled across your blog this afternoon flying from Denver to Atlanta. I used your program and changed the standard deviation of the random walk. This made an interesting plot. I’m going to post my picture on my blog.