Toss one hundred different balls into your basket. Shuffle them up and select one with equal probability amongst the balls. That ball you just selected, it’s special. Before you put it back, increase its weight by 1/100th. Then put it back, mix up the balls and pick again. If you do this enough, at some point there will be a consistent winner which begins to stand out.
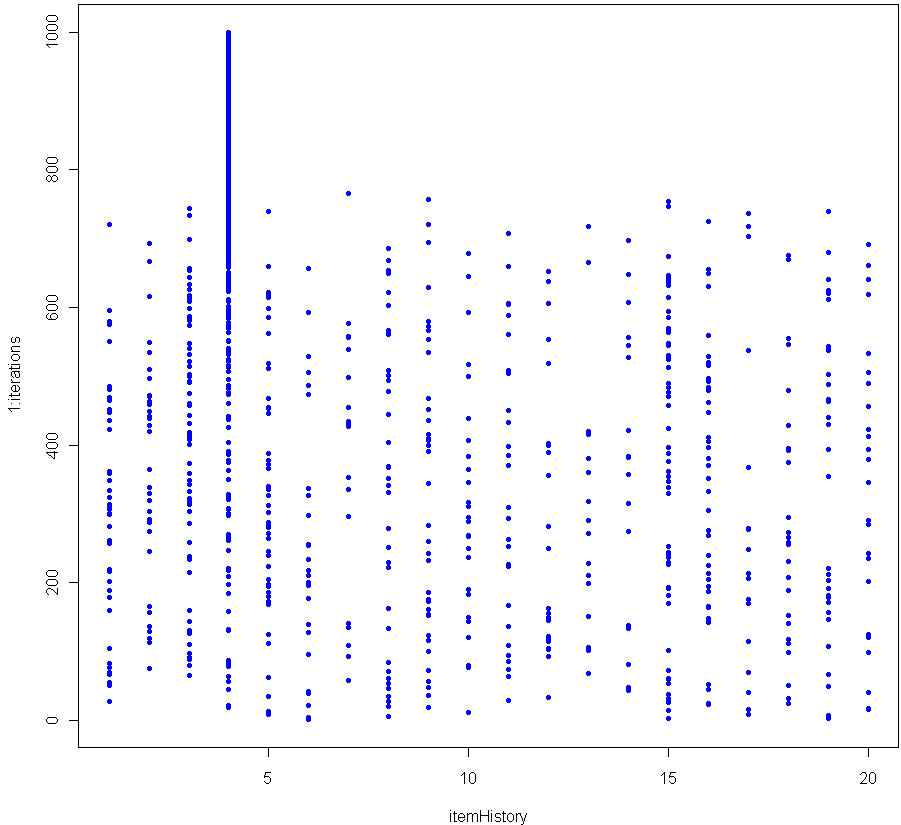
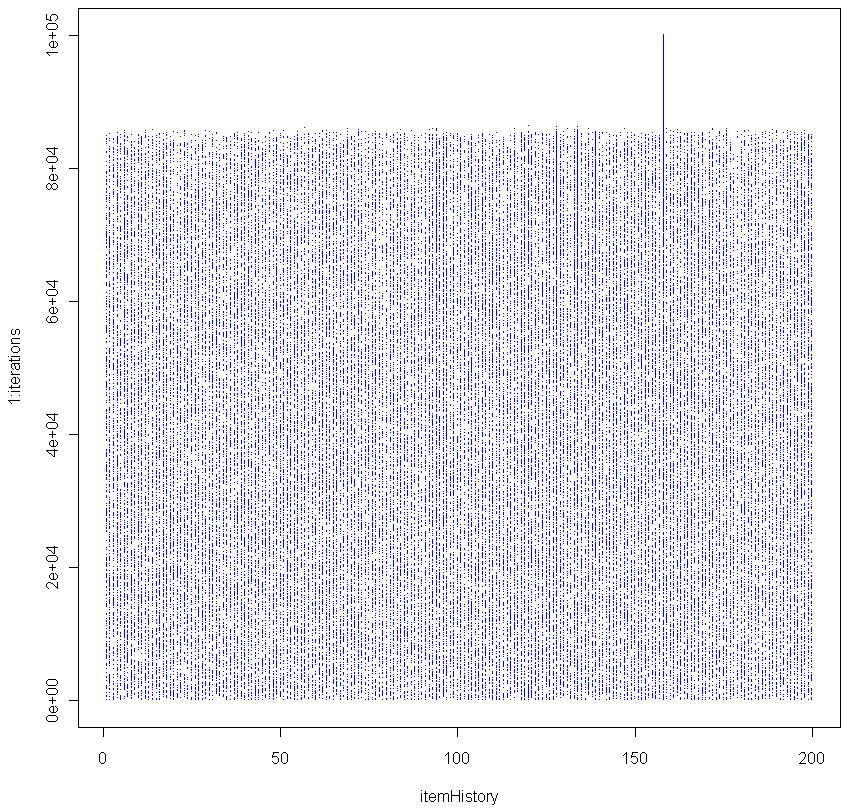
The graph above shows the results of 1000 iterations with 20 balls (each victory increases the weight of the winner by 5%). The more balls you have, the longer it takes before a clear winner appears. Here’s the graph for 200 balls (0.5% weight boost for each victory).
As you can see, in this simulation it took about 85,000 iterations before a clear winner appeared.
I contend that as the number of iterations grows, the probability of seeing a Chosen One approaches unity, no matter how many balls you use. In other words, for any number of balls, a single one of them will eventually see its relative weight, compared to the others, diverge. Can you prove this is true?
BTW this is a good Monte Carlo simulation of the Matthew Effect (no relation).
Here is the code in R to replicate:
numbItems = 200
items = 1:numbItems
itemWeights = rep(1/numbItems,numbItems) # Start out uniform
iterations = 100000
itemHistory = rep(0,iterations)

for(i in 1:iterations) {
	chosen = sample(items, 1, prob=itemWeights)
	itemWeights[chosen] = itemWeights[chosen] + (itemWeights[chosen] * (1/numbItems))
	itemWeights = itemWeights / sum(itemWeights) # re-Normalze
	itemHistory[i] = chosen
}

plot(itemHistory, 1:iterations, pch=".", col="blue")
After many trials using a fixed large number of balls and iterations, I found that the moment of divergence was amazingly consistent. Do you get the same results?
Tags: Matthew effect, monte carlo, probability, r


What is the purpose of re-Normalization? Is seems that without it, the chosen one stands out just fine.
I think you are implementing the (basic?) form of the Polya Urn scheme in the case all balls in the urn are of different colors, since your line of code
itemWeights[chosen] = itemWeights[chosen] + itemWeights[chosen] /numbItems
is [almost] equivalent to replacing the chosen ball with tw balls of the same color. (I write [almost] because you do not update the weight as
itemWeights[chosen] = itemWeights[chosen] + 1/numbItems
and the number of balls as
numbItems into numbItems+1
after each replacement, which would be the case for the Polya Urn process. I also think that keeping numbItems fixed is not compatible with your description of a 5% weight increase.) The limiting behaviour of the Polya Urn process is known to be concentrated on (0,1) for the probability of drawing ball i. Hence the same for your process because the weights on the chosen balls are increasing with the iterations…
@Maxim:
If you don’t re-normalize the weights each time than the Chosen One is eventually assigned a weight of “Inf” (ie a number too big for R to handle), which causes an error. This way the weight of the Chosen One becomes 1 while the others become ever smaller.
@xi’an
Good call. It is like Polya’s with fixed number of balls, unlimited colors, and fractional weightings. I’m not sure why “numbItems fixed is not compatible with your description of a 5% weight increase” though perhaps I should have made clear that a 5% increase in weight is *not* exactly the same as a 5% increase in the probability a ball will be picked. I didn’t want to go into that nuance in the post, but here’s an example of how the math works:
If you start with 10 balls, each with p=0.1 of being picked, then when you increase the weight of the first winner its new p=0.1089, an increase of 8.9% (because new p=1.1/sum(itemWeights), where we have yet to re-normalize the weights). Weight always rises by a fixed 10%, but the closer a ball gets to dominating the others, the slower its probability of being picked increases. If p grew by a (fixed) 10% each time it would soon surpass 1, which as we all know would bring on Probabilistic Armageddon because such a thing can’t happen in our universe. Maybe in some other universe (there’s a thesis idea for you, build a mathematical universe where p can exceed 1), but not in this one.
Hi guys,
I really enjoy your blog, and have been using it to help develop my R skills. I am probably your least statistically knowledgable reader but I do enjoy working through your examples and trying to extend them. Thanks for another fun post!
I replicated your results at a variety of item counts and was surprised to see such a low variability between trials (~8.4% for 200 balls, ~2.6% for 500, n = 20) and a pretty clear relationship between iterations to divergence (y) and number of items (x):
y = 1.942 * x^2
I’m curious how you would measure the moment of divergence. I looked for the iteration where the last thousand iterations had the same result, then subtracted 1000 from it. Any suggestions for a better way?
Thanks!
@Tim:
I don’t think there’s any non-arbitrary way to measure the moment of divergence. What you did makes sense. You’re formula is good for certain ranges, but I suggest you do a log-log plot for a wide range of numbItems. Try this:
1. Generate a whole bunch of different numbers to test going up to a fairly high amount. For example, I used this code to generate the ones to test:
numbItemsVector = floor(c(1.15^(23:45)))
2. Keep track of when each diverges. Use your method, or, for a quick test, after normalizing the weights see if the Chosen item now has weight 999 times more than all the others combined:
if(itemWeights[chosen] > .999) { # Store results and break
3. Plot log(iterationsToDivergence) vs log(numbItems).
How does that look?
Cheers!
Matt,
Thanks for the reply! I’ve used
items = c(5, 10, 20, 50, 75, 100, 200, 300, 400, 500, 600, 700, 800)
which is about as far as my machine will let me go in a reasonable amount of time. On log-log paper the plot of divergence point vs number of items is linear until about 600 items, where it appears to change slope. In normal coordinates it looks exponential as I modeled but seems to be linear > 600. Do you see something similar? I’ve seen it in two simulations so far, but don’t have an intuitive sense for why that would be.
Thanks again!
I tried to calculate the moment of divergence as the iteration when the last ball, but not the winner appeared, by looking backwards in itemHistory. The code looks like this:
for (i in iterations:1 ) {
if (itemHistory[i] != chosen) {
break
}
}
The resulting distribution of moments of divergence for 200 trials (100th iterations each) looks like this:
http://gis-lab.info/images/screenshots/20100903-872-37kb.jpg