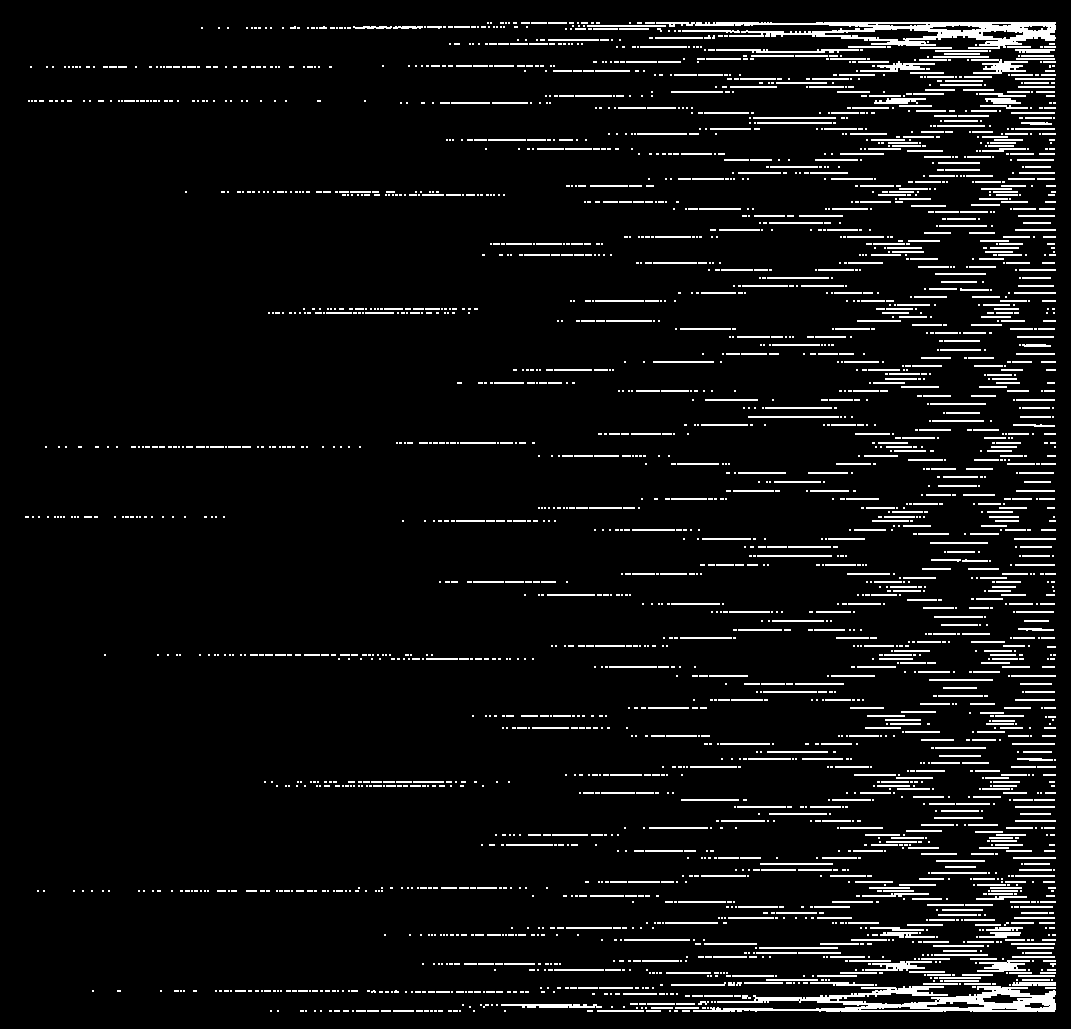
$100 to the first person who can figure out how I created this plot and replicate it. Some hints:
- It was done in R.
- There is only one underlying probability distribution involved (one “
rdist()“). - Including the “plot” statement, I created this with 3 short lines of code.
This is based on a random sampling of unstated size, so I don’t expect that your graph will be an absolute, exact match.
I’ll add $1 to the prize for every day that goes by without a winner until the end of the year. After that I’ll consider it an unsolved mystery and reveal the code I used.
Post your guesses for the code as a comment to this post. First correct answer wins. Good luck to all!


What’s the first line ?